![]() Attenuation
is a term to describe the gradual loss of sound. It is simply a
demonstration that there is inefficiency in waveforms. If there
weren't attenuation, then that would mean that they were both
perfectly efficient and creating energy in order to keep the same
amplitude while spreading. Attenuation doesn't just take place in
sound waveforms, however, it also occurs in electromagnetic waves.
According to various charts, the higher the frequency the greater the
attenuation. The following is attenuation through some sort of
cabling, most likely fiber optics, showing that the attenuation grows
greater as the frequency increases. To prove this, as well as prove
if air is a greater or worse medium, I decided to test the
attenuation of sound waves.
Attenuation
is a term to describe the gradual loss of sound. It is simply a
demonstration that there is inefficiency in waveforms. If there
weren't attenuation, then that would mean that they were both
perfectly efficient and creating energy in order to keep the same
amplitude while spreading. Attenuation doesn't just take place in
sound waveforms, however, it also occurs in electromagnetic waves.
According to various charts, the higher the frequency the greater the
attenuation. The following is attenuation through some sort of
cabling, most likely fiber optics, showing that the attenuation grows
greater as the frequency increases. To prove this, as well as prove
if air is a greater or worse medium, I decided to test the
attenuation of sound waves.
The problem is this: according to this chart, as I raise the frequency of the sound wave, the attenuation of the sound should increase (AKA: the difference between two measurements will raise as the frequency increases). Or, if the frequency raises, then the attenuation increases, because of more energy loss.
The independent variable in this will be the frequency. We will tweak it to a variety of frequencies in order to capture a good range, the dependent variable will be the input amplitude from the decibel meter, and the control variable will be the distance of the decibel meter from the output medium (the speaker).
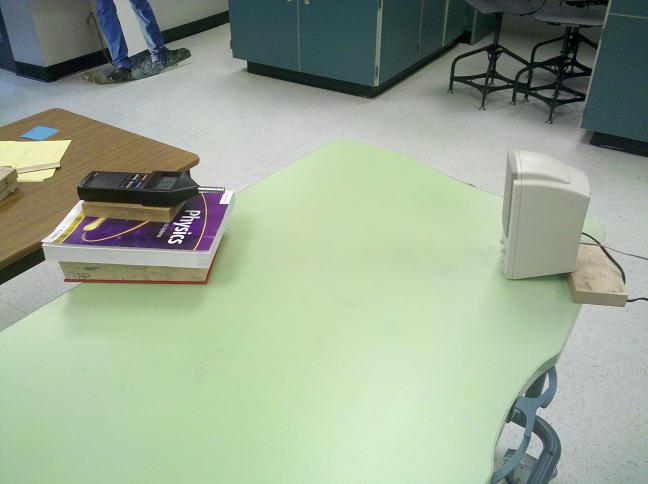
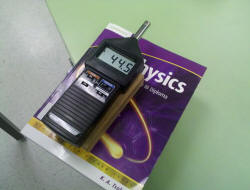
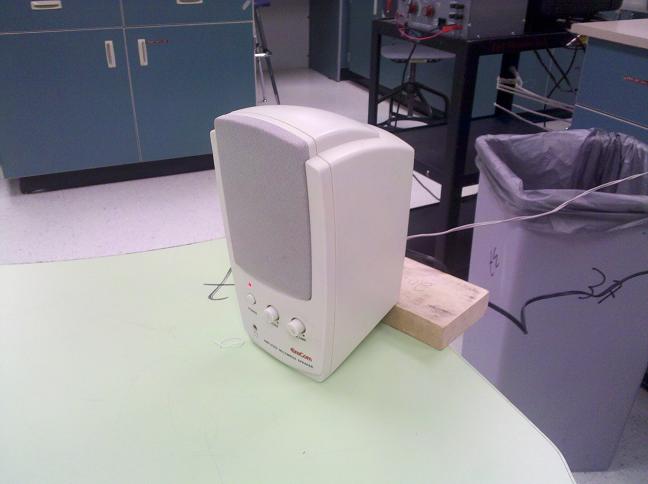
The setup is as follows: One speaker, one decibel meter, one meter stick, a computer with test tone generator on it, and various supplies to make sure the decibel meter is as close to level with the speaker as possible. The speaker will be placed on one end of the apparatus, plugged into the computer. It would be best to make sure that the area in front of the speaker is clear, so you don't get any interference from echoes. Use the meter stick to measure out a certain distance from the speaker, and then place the decibel meter there. Use some textbooks or some other flat surface in order to raise the decibel meter to about the same height as the speaker. Use “test tone generator” to generate whatever sound frequencies you need. It may help to select a median frequency and get it to reach a certain amplitude, so you don't end up dipping below whatever background noise there is (just a single computer can make around 40-45 dB of noise.) We ended up setting it so that 440 dB ended up around 80 dB from half a meter away. Then we started at 55 Hz, and increased by a fifth, then a fourth, alternating between the two until we reached 7040 Hz. With each frequency, we recorded the amplitude at half a meter away. We then moved the decibel meter to a meter away, and recorded the amplitude from a meter away.
 |
 |
 |
The
results of these only raise questions (and issues). There should've
been a slightly noticable correlation between the differences, but
instead they're rather chaotic and random. Instead of a simple slope
or a gentle curve, the differences ended up being random and
unintelligible.
 As I said earlier, the results ended up being far from
appealing. They were random, and seemingly inconclusive.
As I said earlier, the results ended up being far from
appealing. They were random, and seemingly inconclusive.
According to my original hypothesis, the attenuation should have increased as the frequency increased, because there would be more energy to lose to inefficiency (higher frequency = more energy).
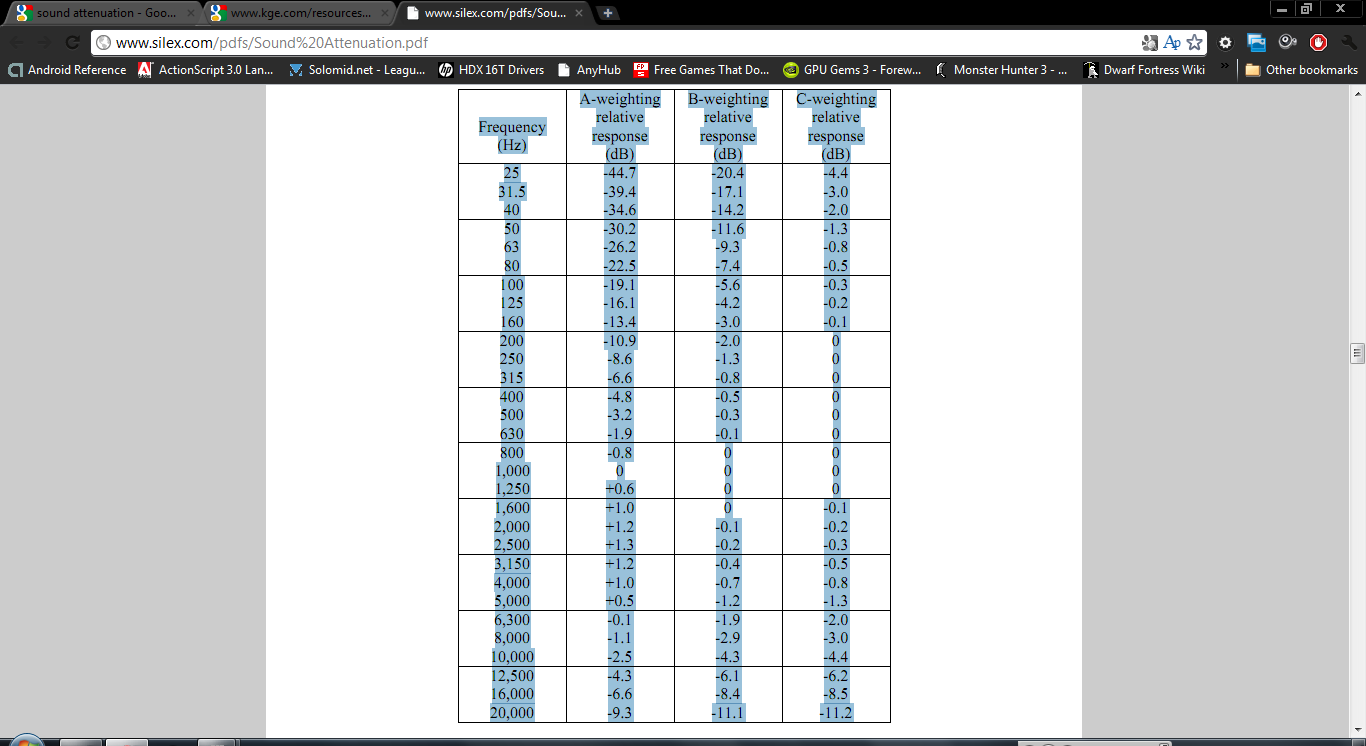
According to a variety of resources, one possible problem was the decibel meter. Although it should've been taking results in C-mode weighting, it seems to be more like A-mode weighting, which emulates the human ear. The reasoning behind this is because there is one area where the difference is greater than 0, which shouldn't ever occur in reality. Additionally, the acoustics of the room may not have been ideal, with large amounts of background noise.
If we were to redo this lab, I would advise using a room with better acoustics, and make sure that the device that records the amplitude is properly C-weighted, so you get correct results. For best results, you should also get a speaker or sound output medium that has little variability based on frequency.
Sound
Attenuation, Silex,
<http://www.silex.com/pdfs/Sound%20Attenuation.pdf>
Contains information on attenuation and sound weighting
Technical
Perspective: Sound Measurement and Attenuation, Generac Power
Systems, <http://www.kge.com/resources/9282785.pdf>
Contains information and a formula for sound attenuation