The Effect Of Length On An Oscillating Cantilever | Background | Statement of the problem | Hypothesis | Method | Procedure| Results | Conclusion | Bibliography/Links |Return to research
As a young boy, I would always find ways to be a troublesome kid. This one time I saw a flat metal rod lying in my parent's equipment room. My first instinct was to start swinging it and break something. So I started swinging it obnoxiously and noticed it felt oddly light, but as I changed the grip and got farther from the edge, I realized that the swings took more strength to swing side to side and more notably it took a long time to reach the origin compared to the closer grip. I got curious, I proceed to lay it flat on the table and try reaching the same results and conclusions. I succeeded and It got me curious as to why that is, more specifically, how does the distance from the edge of a ruler affect the period of the stick, and is it a linear or non-linear correlation?
An Equation to output the period of the system would be:
* Source: IB packet
However because of data published by Tugraz the effective spring constant would be inversely proportional with the overhang length

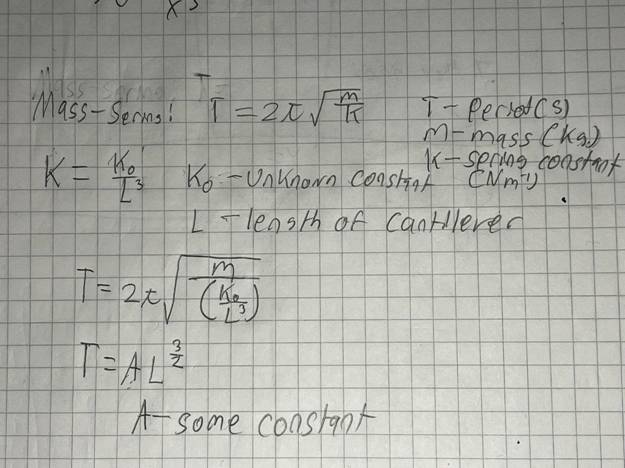
*Dimensional Analysis used to find the power of x
Now based on the formulas we can simplify the Period formula to give us a constant multiplied by length to the power of 1.5, Meaning that x is to the power of 1.5
Statement of the problem .:. TOP
The purpose of this investigation is to know the effect the overhang length of the oscillating flat bar has on the period of the system. The independent variable for this experiment will be overhang length which is defined as the distance(in cm) from the edge to where the bar has contact with the table and clamp. The dependent variable will be the period of the system which is in seconds. The controlled variables for this experiment are the pressure used to flick the bar, I would make sure to use only my shoulder and fingertip to apply pressure at the long side of the bar nearing the edge.
I believe that graph-wise (with the Length from the edge as the independent variable and the period as the dependent variable), as the overhang length increases, the period will increase at a power greater than one
● Flat metal bar(91cm(L) x 3cm (W) x .5cm(H))
● Meter stick
● Labquest mini
● Vernier Accelerometer
● Pc w/logger pro
● C-Clamp
● Table
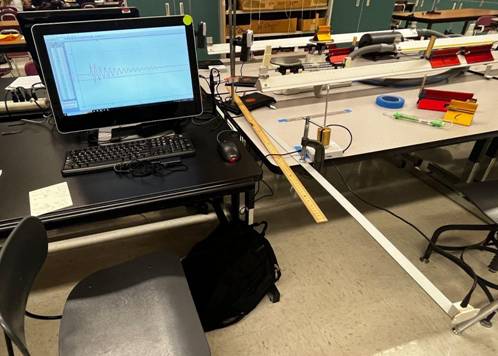
*Main Setup for collecting data
I would begin setup by opening Logger Pro on a pc and configure the labquest mini with the corresponding accelerometer by setting the sampling to 1000 samples a second for 4 seconds.
Afterward, I would set the dependent variable (metal bar overhang length) to 20 cm from the edge of the table and clamp down so that the edge of the clamp and table are aligned vertically to be consistent.
Once I finish collecting 5 trials of the same length I would increase the length by 4 cm and end at a total of 60 cm of overhang length leaving me with 10 variations. I chose the number for my variations and trials to minimize any error possible from not getting enough data sets.
To begin collecting data I would press run then apply pressure to the long side of the bar nearing the edge using only my shoulder(keeping my forearms and wrist still) and middle finger(tip) that would release as soon as my finger slips to keep the pressure consistent as possible. As for safety, there was no need for gloves on the edges of the metal bar because it did not have sharp edges other than the corners.
For my independent variable, I note the timestamp of a smooth peak and another, 4 peaks after, that are at least 3 peaks away from the initial peak to avoid any error. To get the period of the system I would divide the time difference of the peaks by 5 leaving me with the average period of the system in seconds.
Before creating my main data table, I first had to calculate the period, so rather than inputting them one by one I used a spreadsheet and equation command to make the calculations faster.
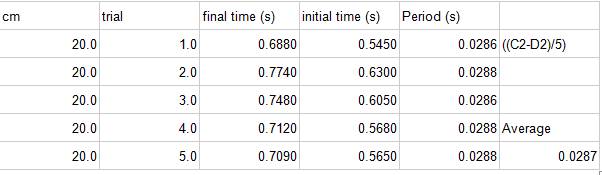
Figure #1: Organized Data
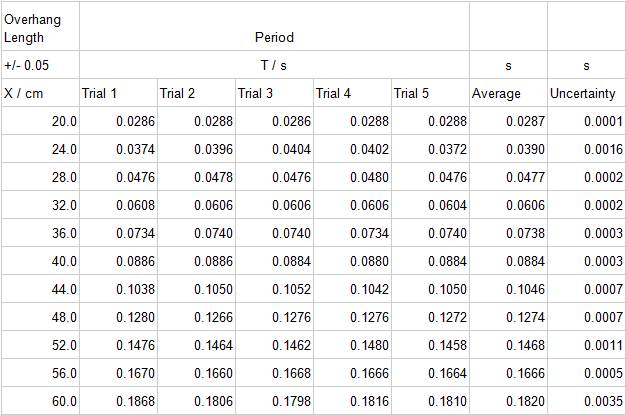
*My data table with labels, uncertainties and units
Figure #2: Graph of Organized Data
*Graph based on data from Figure #1
Figure #3: Data linearized using Log X and Log Y
*Data from Figure #1 linearized using a log-log graph\
Figure #4:Data linearized using 1.71
*Data from Figure #1 linearized using y^(1/n) graph
Based on the data the period of the system grew in a non-linear manner meaning there was an inversely proportional relationship between the overhang length and the period. However, because the n-value(1.71 on figure #3) didn’t match the expected value of 1.5, but was somewhat close, the realization hit me. I did not account for the mass increases as the length grew, which meant that the k value was decreasing.
Limitations:
Uncertainty because of human error very much occurred in this experiment. Possibly in the pressure applied to start the oscillation, Setting all the measurements exactly to the corresponding variation. I could not increase the number of variations because of the length of the cable. The longer it got, the more force was required to keep the cable from sagging below the bar which would cause the amplitude to decay much faster.
A few ways to improve this experiment could be getting a bar longer than 91 cm, an easier way to prevent the cable from affecting the amplitude and rate of decay. More accurate way of applying consistent pressure to the edge of the bar
Overall though, I’m very content with reaching a number that is somewhat close to the expected value of n and unveiling the relationship between period and overhang length.
· https://www.youtube.com/watch?v=Eqjfw56tV1Q – learned about young modulus
· https://www.youtube.com/watch?v=dDshiu5um9g – Video of how the ruler looked when it was oscillating
· http://lampx.tugraz.at/~hadley/memm/mechanics/cbeam.php#:~:text=and%20the%20effective%20spring%20constant,EI%2FL3x – Helped me derive a formula for the spring constant of the ruler
· https://www.khanacademy.org/science/physics/mechanical-waves-and-sound - helped me understand how oscillations work
· https://openstax.org/books/physics/pages/5-5-simple-harmonic-motion - Helped me know the many forms of simple harmonic motion
Bibliography/Links .:. TOP:
● IB Packet
○ Used to find length to the power of 1.5