Determining the Relationship Between Distance and Magnetic Field Strength
Student code : kmk616
Intro | method | Data | Conclusion | Related link | Return to Research
As a kid magnets fascinated me: the simple fridge magnet or a bag of little magnetic balls would entertain me for hours. The invisible force between them that pulled them together and repelled them was pure magic to a small child like me. However, one of the main limiting factors of these toys was the magnets would only attract objects until a certain distance.
Magnetic fields
In the case of magnetic toys, the “magic” that created these forces was a result of magnetic fields. Magnetic fields surround magnetic materials (like fridge magnets & magnetic toys) or they can be created by electric currents. Magnetic objects that are in a magnetic field experience an attractive or repelling force. All magnets are dipolar meaning they have a north and south magnetic pole. The force of attraction, magnetic flux, exits out of the north pole and enters through the south pole creating a loop.
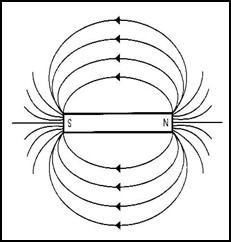
Figure 1: Image from “A gallery of magnetic fields.”
Magnetic fields can be visualized as an array of lines as illustrated in Figure 1. These lines start at the north pole of a magnet and start to ‘fan out’. As they fan out they begin to move back towards the south side creating an almost circle-like shape where the line starts at the north pole and ends at the south.
This diagram provides not only a visualization of the magnetic field, but allows for determination of the strength of this magnetic field at specific points. To do this one must imagine each of the lines having some amount of force acting in the direction they are facing, and count the number of lines that pass through a chosen point, adding them up for field strength.
Magnetism and, consequently, magnetic fields are the backbone of many modern-day technologies. They are used as the primary way to convert electrical energy into physical energy through the use of electric motors or speakers. Magnetism is used to store data in computers and similar machines. It is even used in the medical field for MRIs (non-invasive scans of the human body). There is great importance in understanding the functions and aspects of magnets and magnetic fields if we are to continue using them for future technologies.
Electromagnetic Coils
In this investigation, I will be using an electromagnet instead of a permanent magnet. The difference between a permanent magnet and an electromagnet is that a permanent magnet is always magnetized while an electromagnet (or an electromagnetic coil) is only magnetized when a current is run through it. Additionally, coils are stronger and cheaper making them the preferable option.
Magnetic Fields in This Investigation
In this investigation, the magnetic field strength of a coil and its relationship to distance will be explored. Referring back to the visual in Figure 1, I think that the two variables (field strength and distance from field) will have an opposite proportional relationship.
I hypothesized that the field strength and distance from the field would have an opposite relationship because if you take an object and increase its distance from the magnet there will be fewer magnetic field lines passing through it because a portion of these lines turned back towards the south pole of the magnet (as shown in the diagram). This means there will be less force acting on that object, meaning the magnetic field strength gets weaker as you get farther from the magnet.
I also hypothesized that the field strength and distance from the field would have a proportional relationship. This is because the magnetic field lines emitted from a magnet move out in a spherical shape and as they do they spread out over an increasingly larger area. As the distance increases the area that the lines spread out over increases at a proportional rate (meaning the density of the lines will decrease), and since the number of lines passing through a point determines the magnetic field strength this means that the magnetic field strength also deteriorates at a proportional rate.
The purpose of this investigation is to determine the mathematical relationship between the axial distance from a solenoid and the strength of its magnetic field. I’ve limited my experiment to use a single coil with the same current. The current and type of coil shouldn't change the relationship between distance and field strength so a single coil with a constant current will be sufficient.
By using a ruler and pieces of tape to mark specific points I measured the distance between the edge of the coil and the tip of a Hall effect probe. Using the Hall effect probe and the LabPro data-logging interface and computer system, the strength of the magnetic field was measured for ten seconds (with about 200 points recorded in this time). Since the system isn't perfect the magnetic field had slight fluctuation so an average had to be taken rather than one single point.
Experimental Variables
The independent variable is the strength of the magnetic field, measured in milliteslas (mT).
The dependent variable was the distance between the coil and the Hall effect probe (distance between the edge of the coil and the tip of the Hall effect probe), measured in centimeters (cm) by increments of 0.5 centimeters.
The controlled variables consist of but are not limited to keeping a constant current of 5 amps, maintaining the exact angle of both the coil and Hall effect probe and maintaining a contrast radius and length of the coil.
Experimental Method
To measure the magnetic field strength I used a Hall effect probe (the probe), automatically recording the field strength every 50 milliseconds for 10 seconds (resulting in 200 data points). The average of these points was used as the magnetic field strength at each distance. Fluctuations due to an imperfect system resulted in a minimum uncertainty of 0.08 to 0.004 mT over all points. Figure 2 illustrates the experimental setup:
.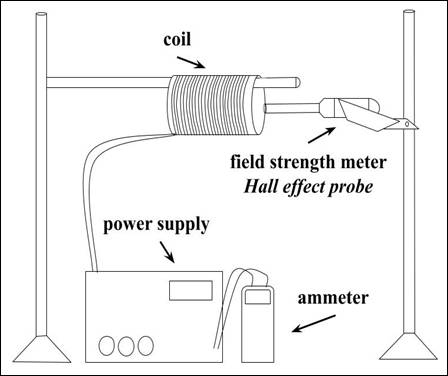
Figure 2: Experimental setup.
To measure the distance between the coil and the probe I used a ruler. To only have to measure distance in the horizontal direction, the probe would need to be positioned directly in the center of the coil (preventing the need to measure the distance between the probe and the top or side of the coil). However, this made it very difficult to measure the distance between the edge of the coil and the probe since the coil was physically in the way. To address this issue I used a piece of tape to mark where the tip of the probe was on the rod that the coil was resting on, allowing for distance to be measured on a flat plane rather than it being angled.
I used a connected ammeter to maintain a constant current between all of the trials. Additionally, I used the same coil for all the trials making sure not to alter the wire arrangement or the coil's angle with respect to the probe.
Raw Data | Data File: excel.:.text
Table 1 : data showing the relationship between magnetic field strength and distance (includes data for 0 to 0.4 seconds only due to space limitation).
Table 1 contains an abridged section of the raw data, showing the first nine time intervals (0 to 0.4 s) for each distance (the full table includes all 0.05 s intervals between 0 and 10 s). The data has been shifted in order to account for the zero error of the Hall effect probe which was obtained by measuring the magnetic field strength with no current in the coil. Without current, the meter recorded an average field strength of -0.03912 mT, and this amount was subtracted from each observed measurement in order to calculate the actual value of the magnetic field strength.
The mean magnetic field strength was calculated by averaging all the magnetic field strengths measured over the 10-second period (200 points at increments of 5 ms). For example, when x = 0.0:
![]()
Since the differences between the maximum and minimum values were significant, the uncertainty at each distance was calculated using the function:
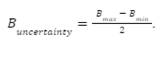
For example, the uncertainty at x = 0.0 was calculated as:

Table 2 : Average magnetic field strength over 10 seconds.
Graphical Analysis of Raw Data
When reviewing the data graphically, it is apparent that the relationship between magnetic field strength and distance is non-linear (i.e., the linear trendline only passes through two or three points). The shape of the data more closely resembles proportional decay since the rate at which field strength decreases proportionally becomes smaller over distance.
Figure 3: Graph of average field strength over distance with a proportional trendline (done in excel).
Figure 3 illustrates that a proportional trend line is obviously a better fit for the data points. The data decreases proportionally and never reaches zero, which fits the rules of a proportional function. Additionally, the R2 = 0.993 further reinforces the idea that a proportional trend line is a better fit than the linear trendline of Figure 3.
Since the line approaches but never reaches zero, it can be assumed that the data can be represented by a proportional decay function:
![]()
This means that the field strength and distance have an inversely proportional relationship. In order to determine the values of this function, it is necessary to plot the logarithmic field strength against distance.
Logarithmic Analysis of Data
In Figure 4, the values on the y-axis are the natural log of the average magnetic field strength (abridged data are listed in Table 3). This is done in order to solve the values of a function through the use of a linear formula rather than a proportional formula:
![]()
Taking the natural log of both sides results in
![]()
Figure 4: graph of the logarithmic average field strength over distance with function (done in google sheets).
The formula of the logarithmic graph is y = -0.34*x + 0.16 as shown in Figure 4. With
this function, each of the variables for the power function can be solved.
First, k is already solved because it's just the slope of the logarithmic function -0.34.
To solve for A you need to set the y-intercept of the logarithmic function equal to ln(A):
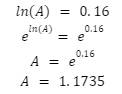
And then plugging in the variables results in the proportional formula:
![]()
Table 3: natural log of average magnetic field strengths
Conclusion
By analyzing the data, it can be concluded that the relationship between the distance from a solenoid and the strength of its magnetic field is an opposite proportional relationship. This can be seen through the function of the trend line in Figure 4. The line best fit is a proportional function that approaches zero meaning it's an opposite proportional function.
This result fits my initial hypothesis meaning my initial reasoning as to why they have this relationship is most likely correct. The reason the data approaches zero as distance increases is that fewer magnetic field lines reached the Hall effect probe as it was moved further away from the coil. The reason it was proportional was that the field lines had to cover an area that grew proportionally with distance.
Reflection
Throughout this investigation I became aware of the limitations of the data and the execution of the lab. The main limitation was time; having a limited amount of time to prepare and conduct my experiment meant parts of the process were rushed, leading to a multitude of problems.
One problem this presented was the short range of data. The data collected in this investigation did not display the maximum magnetic field strength because I started from the edge of the coil. Additionally, I didn't measure past an eight cm distance due to time constraints. This made it so that my function to determine the relationship between the two variables is only valid between the edge of the coil and the 8 cm range. In order to fix this mistake in possible future experiments I would need to record the magnetic field strength starting a greater distance away from the coil (around 15 cm) and then get measurements all the way through the coil to the same distance on the other side of the coil. Not only would this allow me to compare the data from the two sides of the coil (they would be the same values but one would be negative), which would give me the ability to check the validity of my data, but also it would allow me to find a more accurate function between distance and magnetic field strength.
Another error that led to a possible discrepancy in the data was the method I used to measure the distance. Measuring with a ruler was very difficult due to the experiment setup so I relied heavily on my initial measurements and my placement of the tape. This could have resulted in slight inconsistency with the measurements. In order to fix this in future experimentations I would use a camera in a fixed position to measure the distance digitally with the same perspective during each trial.
If I were to do this experiment again I would take into consideration these issues and possible solutions but I would also like to test the effects of different currents on the magnetic field strength. With that data, I could determine how the function scales with different magnetic strengths. In addition to changing the currents another variation that would provide more insight into the relationships between distance and field strength would be the angle at which the Hall effect probe would measure the field strength. This would allow me to further predict the behaviors of magnets in scenarios where the magnet is not perfectly aligned with a magnetic surface. There are endless different scenarios in which some environmental factor will change how a magnet functions, however having the function for distance in conjunction with these two proposed experiments would allow for reasonable predictions relating to the magnetic field strength of a magnet
https://www.millersville.edu/physics/experiments/023/#:~:text=Magnetic%20Fields%20Varying%20as%20an%20Inverse%20Cube&text=For%20both%20monopoles%20and%20dipoles,distance%20from%20the%20source%20increases.&text=%2C%20often%20called%20the%20inverse%20square,distance%3B%20as%20R%20%2D3%20. Similar experiment with a more concrete answer to the question. Instead of very specific weird formula they say its the inverse cube law.
https://www.electronics-tutorials.ws/electromagnetism/electromagnets.html Further information about different factors in magnetic strength. Talks about how the windings and amps effect the magnetic field as well.
https://ece.northeastern.edu/fac-ece/nian/mom/electromagnets.html#:~:text=Electromagnets&text=Electromagnets%20are%20a%20different%20from,coils%20behave%20like%20a%20magnet. If the above info wasn’t in depth enough, this one Gives an in depth explanation of electromagnetic and electromagnetic fields.
https://www.eclipsemagnetics.com/resources/difference-between-electromagnet-permanent-magnet/#:~:text=However%2C%20Electromagnets%20are%20distinguished%20from,electric%20current%20to%20generate%20magnetism. More in depth information on the difference between permanent magnets and electro magnets. Explains how they are made and what they do.
https://www.universetoday.com/39295/uses-of-electromagnets/ gives some examples and past tech that used electromagnets, so you can see what it is used in the current day.
Bibliography
“Experiment of the Month.” Millersville University, March 7, 1970. https://www.millersville.edu/physics/experiments/023/#:~:text=Magnetic%20Fields%20Varying%20as%20an%20Inverse%20Cube&text=For%20both%20monopoles%20and%20dipoles,distance%20from%20the%20source%20increases.&text=%2C%20often%20called%20the%20inverse%20square%20law.
Hoadley, Rick. A gallery of magnetic fields. Accessed March 6, 2023. https://www.coolmagnetman.com/maggallery.htm.
Williams, Matt. “What Is a Magnetic Field?” Universe Today, October 23, 2016. https://www.universetoday.com/76515/magnetic-field/.