The Why | The Qs | Preliminary Work | The Setup | Gathering Data | Managing the Variables | Data | Graphs | Error | Analysis
| Reflection | Links
Determining Heat’s Effect on Resistance
Jonah Beddes
My father is an electrical engineer, so I’ve always been influenced by him to learn more about how electricity works. Despite his expertise, I’ve struggled to understand many concepts about it. I believe I am primarily a visual learner, so not being able to see what is happening makes it difficult for me. To challenge myself and grow in my knowledge of electricity I’m going to study the effect that heat has on resistance.
Why Heat Affects Resistance Top
It is well understood that the resistance of a conductor is inversely proportional to its cross-sectional area (the greater the area, the less resistance). This is because as a material increases in size, there are more “free” electrons (ones not bound to a nucleus) to flow. Materials considered to be good conductors have more “free” electrons than those that are not considered good conductors. This can be observed by the resistivity formula: ρ = RA/l. As area increases, R must decrease to maintain the same ρ value. But why does heat affect resistance?
In good conductors it is observed that increasing temperature increases resistance. This is because as the temperature increases, the vibrations of each electron increase. These vibrations, as a result of added energy, increase resistance. This is called a positive temperature coefficient. In poor conductors, a different situation occurs. Because there are so few “free” electrons for current to flow, substantial increases in temperature help break off tightly bound electrons from nuclei, allowing for increased flow, or reduced resistance. These materials have what is called a negative temperature coefficient.[1]
The Question and Variables Top
How does heat affect the resistance of copper wire, nichrome wire, and a heating element of unknown composition? The independent variable for this experiment is temperature, and the dependent variable is the resistance. Temperature will be measured in Celcius, and resistance will be measured in Ohms. I hypothesize that an increase in resistance will be observed as temperature increases in the copper wire and resistive wire. However, I believe a decrease in resistance will be observed in the heating element as temperature increases. I believe that the copper and nichrome wires are good conductors, and from my previous research, good conductors have an increase in resistance as temperature increases. I believe that the heating element will see a decrease in resistance as temperature increases because its main purpose is to create heat (i.e. resist flow) and have high resistance. The controlled variables include length and diameter of wire, current supplied by the power supply, and the current supplied by the multimeters to test resistance.
Preliminary Work Top
Component Selection: Copper wire, nichrome wire, and a small heating element will be used to test the effect that heat has on resistance. I chose these materials for a few reasons; copper is considered to be an excellent conductor, being used for almost all wiring in your home. The nichrome wire has significant resistance per meter, however, which I hope will yield contrasting results to the copper wire. Lastly, the heating element was chosen simply out of curiosity. Despite research online, I could not find what materials the heating element is made from, so it will be interesting to see how it responds to the heat.
Methods of Measurement: I will be using two digital multimeters: a Mastech Group MAS830B, and an AstroAI DM130B. They will be used to measure resistance directly using the resistance function, as well as voltage and current to calculate the resistance. The temperature will be measured using a cooking thermometer placed in my oven.
The Setup Top
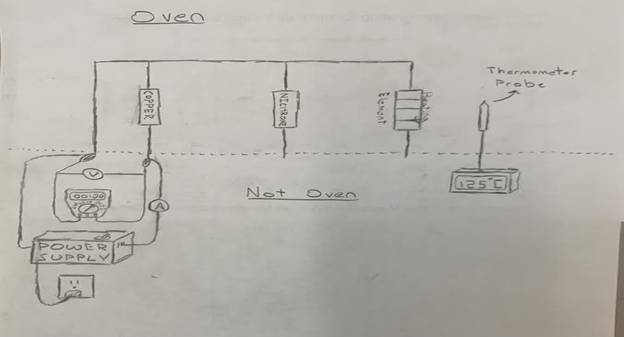
To begin, I soldered one end of each element to a single lead. This lead will stick out of the oven and will be used to connect the multimeters and power supply. The other end of each component will also stick out of the oven and be used to connect the multimeters and power supply. Two coils of copper wire were connected together, totaling about 300 feet of wire. About 2 feet of Nichrome wire was chosen for testing. These lengths were chosen because at room temperature, the wires and the heating element were all around 15 ohms, which puts the measurements in a range where the meter can provide 3 significant figures. Once all soldered components were successfully connected, I placed them in the oven on a non-conductive cooking tray and heated the oven to 126 degrees celsius. Below is a drawn diagram of the schematics.
Below is a picture of the experiment set up
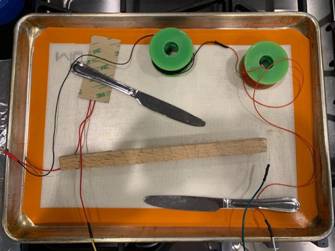
The green circles are spools of copper wire soldered together. The Nichrome wire is wrapped around the wood stick for easy handling. The heating element is facing down with the 3M sticky pad facing up. The kitchen knives are to hold everything in place and serve no other purpose.
Gathering Data Top
After turning the oven off to allow the temperature to stabilize, I hooked up one green multimeter probe to the master lead, and then the other probe to the heating element lead. I made sure to firmly press the leads together to ensure a solid connection. I measured the resistance through the heating element, then did the same for the resistive wire, and then the copper wire. I did the same with the red multimeter as quickly as I could so as to get readings at the same temperature. After directly measuring the resistance, I took measurements for current and voltage to calculate the resistance. I attached the power supply to the master lead, and then to the one probe of the red multimeter. The other probe would be connected to each independent lead of the elements to transfer and measure the current. The green multimeter was used to measure the voltage across each element. After taking an initial measurement, I waited for a temperature decrease of about 10 degrees celsius. I then would take the resistance measurements again, and then the voltage and current measurements to calculate resistance.
Managing the Variables Top
Control Variables: As previously stated, the control variables are the current provided by the power supply, current supplied by the multimeters, and chosen length and area of the wires. The length of wire will not be altered for the duration of the experiment. The leads were pressed firmly together to ensure proper connection while gathering data. The power supply was held at the same voltage level for the duration of the experiment.
Independent Variable: The temperature was allowed to naturally decrease as the oven was turned off. A total of 11 variations and 3 trials were conducted for acquiring resistance measurements. This allowed for consistent gaps of data down to room temperature.
The Complete Collection of Data Top
|
|
||||||||||||||||||||||||||||||||||||||||||||||||||||||||||||||||||||||||||||||||||||||||||||||||||||||||||||||||
|
Resistance by Calculation V = IR |
|||||||||
|
Heating Element |
Resistive Wire |
Copper Wire |
|||||||
|
Temp. (°C) |
Multimeter Voltage (Gr.) |
Current (mA) (Red) |
Resistance (Ω) |
Multimeter Voltage (Gr.) |
Current (mA) (Red) |
Resistance (Ω) |
Multimeter Voltage (Gr.) |
Current (mA) (Red) |
Resistance (Ω) |
|
± 1 |
± .05 |
± 3 |
± .1 |
± .05 |
± 3 |
± .1 |
± .05 |
± 3 |
± .1 |
|
122 |
5.36 |
282 |
19.0 |
5.25 |
316 |
16.6 |
5.15 |
276 |
18.7 |
|
114 |
5.21 |
277 |
18.8 |
5.05 |
305 |
16.6 |
5.10 |
275 |
18.5 |
|
101 |
4.91 |
260 |
18.9 |
5.01 |
300 |
16.7 |
5.25 |
292 |
18.0 |
|
93 |
4.75 |
254 |
18.7 |
4.36 |
264 |
16.5 |
5.00 |
289 |
17.3 |
|
84 |
4.05 |
219 |
18.5 |
4.70 |
285 |
16.5 |
4.97 |
296 |
16.8 |
|
75 |
5.26 |
280 |
18.8 |
4.91 |
292 |
16.8 |
4.95 |
305 |
16.2 |
|
65 |
4.76 |
253 |
18.8 |
4.63 |
270 |
17.1 |
4.73 |
306 |
15.5 |
|
54 |
3.84 |
205 |
18.7 |
5.18 |
312 |
16.6 |
4.95 |
329 |
15.0 |
|
45 |
3.74 |
200 |
18.7 |
5.34 |
321 |
16.6 |
5.17 |
355 |
14.6 |
|
36 |
4.75 |
252 |
18.8 |
3.46 |
210 |
16.5 |
4.82 |
345 |
14.0 |
|
23 |
5.14 |
274 |
18.8 |
4.82 |
292 |
16.5 |
4.68 |
355 |
13.2 |
Graphs of the Data Top
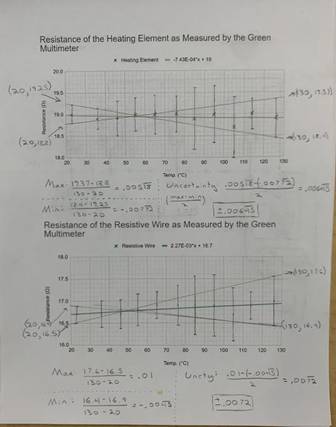
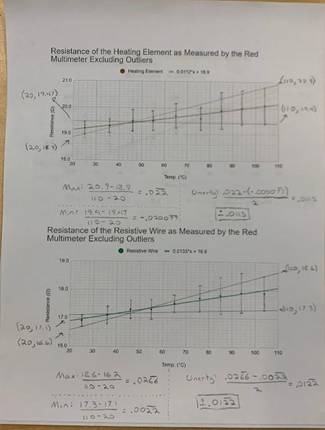
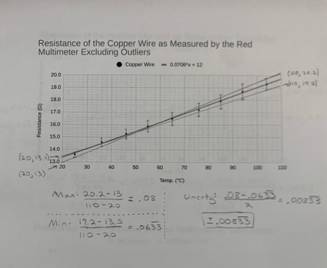
For easy viewing, I have included the graphs with no error bars above. The first graph is of the resistance as recorded by the green multimeter of all three elements through the whole temperature range. The second graph is of the same readings, but as recorded by the green multimeter. The final graph is of the resistance as calculated through V = IR. Below is each graph with the maximum and minimum slopes along with error bars. Each individual function is separated into its own graph with unique errors bars.
|
Green Multimeter Graphs
|
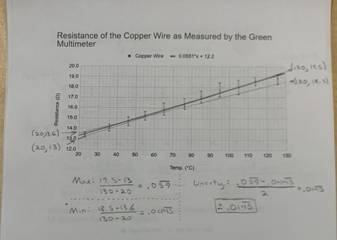
Red Multimeter Graphs
|
|
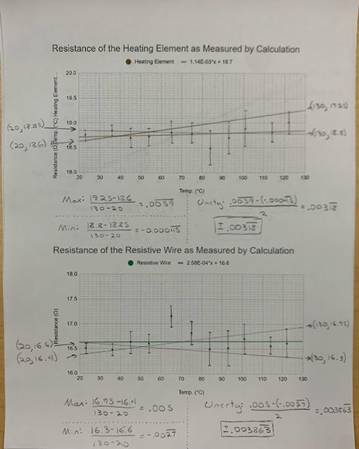
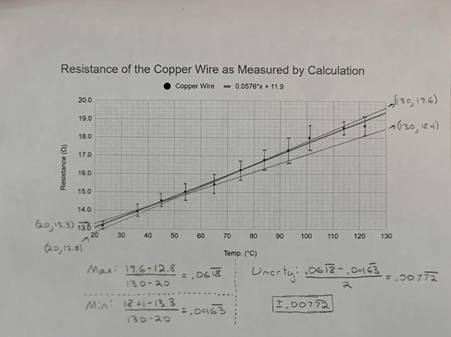
Calculation Graphs
|
Potential Sources of Error Top
1. It may be noticed that two data points were not included for the red multimeter graphs. This is because when graphed, it is obvious that they are outliers and are inconsistent with the other measurements. For this reason I have elected to ohm-it these points from my graphs (get it, omit, ohm-it, it’s a pun!). I hypothesize that my connection of the leads could have been inconsistent, giving me inaccurate reading, however I think this unlikely. I believe the main source of error is the multimeters themselves. They are cheap instruments and have high potential for error. The fact that they both measure upwards of 10% different from each other on non-outlier points is enough to warrant more tests. More expensive meters would have produced more consistent and accurate results.
2. Another potential source of error is shorts in the setup. If some of the nichrome wire were to touch another portion, it would reduce the overall length the electricity would have to travel, reducing the resistance. The same can be said for the copper wire. However, measures were taken to avoid this from happening. The copper wire was fully insulated, preventing any shorts. The nichrome wire, while unprotected, was firmly wrapped around a wooden (non-conductive) stick. Additionally, the components were not moved for the duration of the experiment, ensuring that any potential shorts were not created, nor removed. This allowed for consistent measurements throughout the experiment.
3. The thermometer itself is a source of error. It did not measure to a higher degree of accuracy than whole numbers, so the level of accuracy was reduced to plus or minus five tenths of a degree. While not a significant contributor to error, it is noteworthy. Multiple could have been used to verify the temperature, or one with greater accuracy.
Analysis of Data Top
The observed changes in resistance are fairly consistent with the accepted value for resistance change per degree celsius in the elements. The resistance change per degree celsius of copper is 0.393%[2]. The total change in resistance as measured by the green multimeter was 5.4 ohms, 5.7 ohms for the red multimeter, and 5.5 ohms as measured by calculation. Dividing this by the lowest measured resistance, I get a change of 40.3%, 41.9%, and 41.7% change in resistance respectively. Dividing these numbers by the total change in temperature, I calculated a 0.391%, 0.419% and 0.421% change in resistance per degree celsius respectively. For an amateur experiment done in my home, I am thoroughly impressed with these results. They are very close to the real accepted values for the temperature coefficient of copper.
The results for the nichrome wire are less conclusive, but still encouraging. The actual accepted temperature coefficient for nichrome is 0.017% change per degree celsius. Using the same method as described above yielded a 0.00174% change per degree celsius by the green multimeter, a 0.0749% change by the red multimeter, and a 0.00612% change per degree celsius for resistance measured by calculation. I believe that because nichrome has a high tolerance to resistance change due to temperature, the small errors in my procedure lead to large inaccuracies in overall results. A very small change means that I need high levels of accuracy to measure that change, and I did not have such levels in this experiment.
Lastly was the heating element. While I could not find the temperature coefficient the one selected, I calculated its approximate value. By following the same procedure as above, I calculated a change of -0.00511%, 0.0473%, and 0.0107% change per degree celsius for the green multimeter, red multimeter, and as measured by calculation respectively. Averaging these values yields a temperature coefficient of 0.0177% per degree celsius. I think opening the heating element to discover what materials were used would be an interesting way to compare my calculated temperature coefficient.
Reflection on Hypothesis Top
My initial hypothesis was that an increase in resistance would be observed in both wires as temperature increases, and a decrease in resistance would be observed in the heating element as temperature increased. My hypothesis for both wires were supported by my findings, however my hypothesis for the heating element was not. One of my tests yielded a negative temperature coefficient while the other two yielded positive. More tests are needed to draw a conclusion. In addition to more tests, more precise measurements would greatly improve the validity of the results. Conducting this experiment with much higher temperatures would also help yield interesting results. My oven’s temperature range poses significant limitations which do not allow appreciable difference in resistance change.
[1] https://learnabout-electronics.org/Resistors/resistors_01a.php - For help understanding basic electronics and heats affect on atomic structure.
[2]https://www.cirris.com/learning-center/general-testing/special-topics/177-temperature-coefficient-of-copper#:~: - Information about temperature coefficients of materials and what it means. Formula and variables given.
https://riedon.com/technical/a-resistance-primer#:~:text=Increasing%20the%20temperature%20(typically)%20increases,%3D%20ppm%2F%C2%B0C.) – General knowledge about electronics and temperature coefficients. Also gives information on inductance.
https://www.electricalvolt.com/2020/11/effect-of-temperature-on-resistance/ - Heat’s affect on resistance on conductors and semi-conductors.