Temperature and its relation to viscosity
Table of Contents
◊ Introduction ◊ Materials and Procedure ◊ Setup ◊Analysis ◊ Conclusion ◊ Bibliography ◊ Useful links ◊ Return to Research ◊
The moving parts of mechanical machines have always been a huge aspect of my life and a constant interest of mine, whether it be the way gas engines work or planes fly, they always seem to be a constant part of my life. The first time I really showed interest in combustion engines was when I was in about 1st grade with my first experience with being on a motor boat being around the same time. The boat had this Rumble to it that really intrigued my young impressionable mind and developed a love for machines and their moving parts. Most machines, containing combustion engines, typically require oil. Oil in this case is used to lubricate pistons to allow for ease of movement in engines, and combustion engines typically get really hot, which in turn would heat up the Oil. This intrigued me because different types of oil are rated with different viscosities, which eventually led me to investigate this change in viscosity through a common theory presented in physics in which viscosity is directly related to the viscosity of a fluid. Presented by George G Stokes’s “stokes’ law”
To really understand the way heat relates to the fluid motion of objects we must first understand what viscosity is. Viscosity as defined by Britannica is the “resistance of a fluid (liquid or gas) to a change in shape or movement of neighbouring portions relative to one another. Viscosity denotes opposition to flow. The reciprocal of the viscosity is called the fluidity, a measure of the ease of flow.” Translating that, viscosity is the amount of force that a fluid imposes against objects around it, creating a resistance force. This resistance force then affects the fluidity of the fluid causing an object moving through said fluid to have a greater or lower speed, depending on if the fluid is more or less viscous. We’ll typically measure the viscosity of multiple fluids kept at the same temperature and then compare, however the question I’d like to answer is whether or not the viscosity changes in relation to the temperature of a fluid.
To prove whether or not there is a correlation between temperature and viscosity I will explore whether or not temperature plays a role in the viscosity of a very viscous, common, everyday fluid. corn syrup is the subject of this experiment in which I will measure the viscosity in relation to the temperature of the fluid.
The independent variable of this experiment is the measurable temperature of the corn syrup measured in degrees Celsius. This is changed by the heating and cooling of corn syrup using a hot plate and a beaker full of water. The dependent variable in this experiment is the viscosity of the liquid which will be measured by the speed that it takes a metal bb to travel through 150mm of temperature-controlled corn syrup. My hypothesis for this experiment is that there will be a correlation between viscosity and temperature. I also believe that the fluid will be less viscous the higher the temperature of the corn syrup and more viscous the lower the temperature of the corn syrup.
The materials of this experiment consist of a 150 mm x 16mm test tube, filled with Light corn syrup. A 0.0045m diameter aluminum BB is placed into the fluid to which the test tube is sealed using a test tube plug and some tape creating a seal on the fluid and the BB to create a more controlled environment. A beaker of the same height was filled with water and placed on a lab stove to allow for an even controlled heat for the corn syrup. The water used was tap water, and an alcohol thermometer was used to measure the heat of the water where the corn syrup was submerged. I also used my phone timer and computer to collect the data in a spreadsheet.
Diagram #1
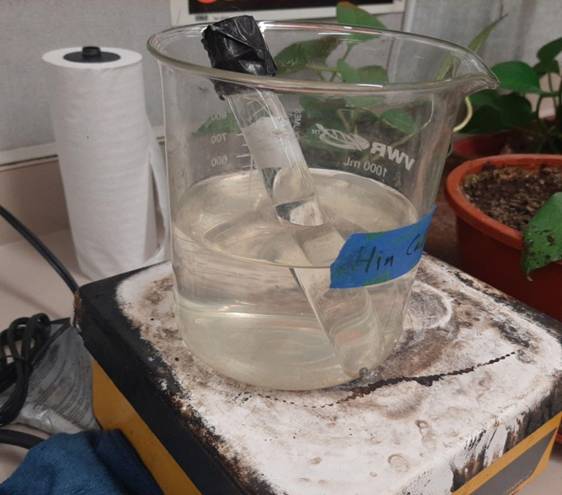
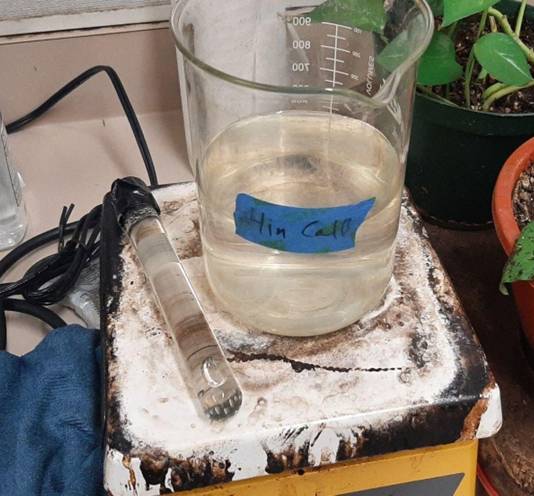
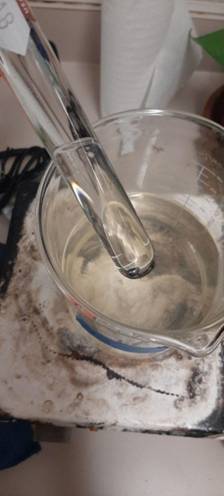
The procedure I took the time and temperature when the water was unaltered by the heat plate (22°C) to which I set up for the first (control) trial, I place my enclosed apparatus in the water so that its temperature can equal that of the water and then I begin the trial, flipping the vial so that the aluminum BB is at the top before flipping it back over and starting my phone timer. I then recorded the time and reset the test for the next two trials. After collecting the trial data I calculated the average time and then the uncertainty of the times before moving on to the next temperature test. After completing the control test I then turned on the heat plate to slowly increase the temperature of the liquid in increments of 5°C, the first temp to the second temperature is the only temperature that strays from the normal temperature increase because it is the baseline or “room temperature.” Setting up test 2 was relatively similar to test one with the main difference being that I needed to watch the temperature so that It didn’t change too drastically while heating up the water. When I reached 25°C, I then repeated the procedure for the data collection of first getting the corn syrup up to temperature and then flipping the enclosed apparatus over to let the BB get back to its original height and then drop to the bottom of the tube. I took and recorded the time it took to reach the bottom on a spreadsheet. This was then done twice more before calculating the average and uncertainty of the data, and then moving up to the next temperature. I increased the temperature in increments of 5°C all the way up to 90°C, at which point my data acquisition was complete.
The experiment was controlled in a manner that allowed the collection of data that didn’t disrupt the experiment and its resulting data. In the experiment, there were several steps I took to make sure that the testing environment was controlled as well as to account for variables that may have affected the results of the experiment. One such control was the way the BB was already submerged in corn syrup. If the BB was outside of the corn syrup before starting the test an unwanted variable of drop height may have affected the results of the experiment, hence why I sealed the tube to prevent this unwanted variable. Another variable would have been air bubbles in the corn syrup which might have caused a discrepancy in the data because of its potential to interfere with the BB’s path resulting in another error in the data; sealing the tube also prevented that discrepancy. The materials were also kept the same to prevent any data errors on that front, all materials were kept the same but if they weren’t could’ve entirely thrown off the experiment and its results if switched midway. I controlled the experiment by keeping materials exact whilst recording my data, this involved using only corn syrup as the fluid of choice, a sealed test tube filled with said corn syrup, a metal BB seal in the fluid, and a beaker filled with water to heat the sealed tube.
The experiment presented no ethical concerns unless you believe the heating of corn syrup and an aluminum BB unethical, but other than that the morality of this experiment is not of questionable origin; its only motivation was to see the connection between temperature and viscosity.
Figure #1
The collection of data was fully developed into a data table (Fig 1)—the collected results. Figure 1 shows the connection between the raw data collected of the time (in seconds) and the temperature (in Celsius). The graph shows that there is a noticeable difference in time from top to bottom of a 150mm test tube. I then took the chart and took the line of best fit on the graph to demonstrate the Corn syrup’s exponential decrease in viscosity due to the temperature’s gain. I also accounted for the uncertainty of the total with error bars, separate from Figure 2 to highlight the individual points better. In Figure 3 we can see that even though the trend line isn’t present the points still line up in the way they do on the previous graph, with the inclusion of the averages due to the repetition of trials to get a more accurate result.
Figure #2

Figure #3
I then linearized the graph to see the effect that the temperature had on the time it took for the ball to get to the bottom in a linear format to see the change. Keep in mind that this linearization is of the time it took for the BB to get to the bottom of the test tube rather than a linearization of the viscosity of the BB, However, I wanted to see if the two graphs were similar enough to each other that if one used over the other they would both be accurate in their results. You can see this linearization in Figure 4 and Figure 5 with both a graph and a data table.

Figure #4
The resulting data taken
from the slope of the graph correlates directly to an exponential function in which ![]() . to find the exponent we find the natural
log of the function, changing our original function into Nlog(y)
= Nlog(x) + Nlog(A) to get
closer to the linearized equation of
. to find the exponent we find the natural
log of the function, changing our original function into Nlog(y)
= Nlog(x) + Nlog(A) to get
closer to the linearized equation of ![]() in
relation to the x with -1.98 is a representation of the exponent of N. Our
Y-intercept on the graph can then be reversed to find A.
in
relation to the x with -1.98 is a representation of the exponent of N. Our
Y-intercept on the graph can then be reversed to find A. ![]() or
about 10 hours, which is completely possible because even when liquid is frozen
or at low temperatures it still acts like a fluid, which would justify the huge time jump of 10 hours because of the exponential
nature of viscosity. In the graph there is some point that is of the question,
those being the last 3 points which drift lower. I uncertain about what the
drift here means, but my guess is that the viscosity gets so low that it sort
of levels out because of such a short distance. And because of the lack of
distance, it reaches a faux terminal velocity because of corn syrup's
fluid nature.
or
about 10 hours, which is completely possible because even when liquid is frozen
or at low temperatures it still acts like a fluid, which would justify the huge time jump of 10 hours because of the exponential
nature of viscosity. In the graph there is some point that is of the question,
those being the last 3 points which drift lower. I uncertain about what the
drift here means, but my guess is that the viscosity gets so low that it sort
of levels out because of such a short distance. And because of the lack of
distance, it reaches a faux terminal velocity because of corn syrup's
fluid nature.
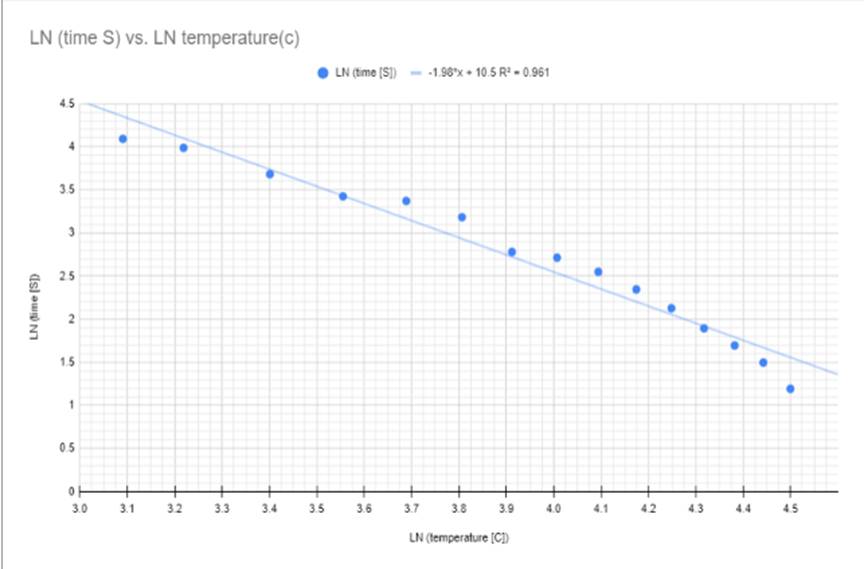
Figure #5
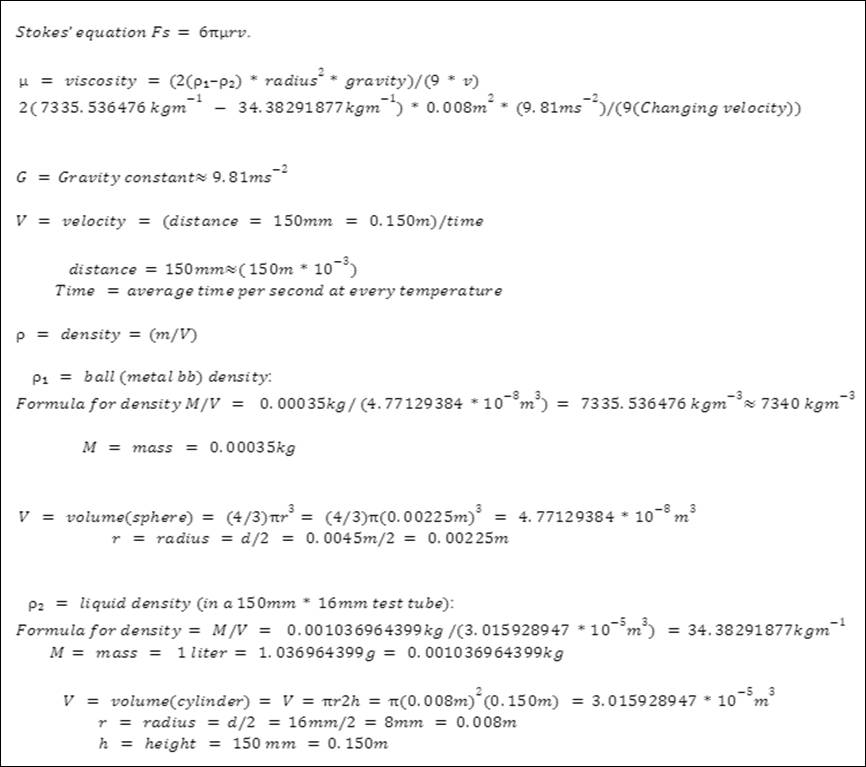
Figure #6
The
Raw data was insightful in the process of determining whether or not the
viscosity of the corn syrup was changing due to the heat of the liquid, but it
became more apparent when I synthesized the data. I took the raw data and then
converted all of my know measurements into measurements that were responsible
for the viscosity of a liquid. Viscosity when defined is the force against
something flowing through the liquid (the resistance force). Which leads me to
the first equation I used to find the viscosity of the liquid, viscosity is
derived from the formula Fs=6πμrv. This can be seen in the
calculations for the synthesized data (see Figure #6) the specific piece
I looked for was the unit of μ which is the symbol that represents
viscosity. I then worked to find the viscosity (μ) by working backward
finding each piece of the formula pre-Fs=6πμrv, which lead me to the
formula for viscosity measured in Pascal’s per second (Pa*s). The formula
for viscosity is shown as ![]() (see
Figure #6) which could then be broken down into core parts requiring me
to find the density, the travel speed (velocity [M/s]) of the BB (see Figure
#7), along with all of the dimensions and weights of all of the pieces of
the experiment (see Figure #6).
(see
Figure #6) which could then be broken down into core parts requiring me
to find the density, the travel speed (velocity [M/s]) of the BB (see Figure
#7), along with all of the dimensions and weights of all of the pieces of
the experiment (see Figure #6).
All of my calculations (see Figure #6) Led to the comparison of the correlation between viscosity and the temperature of the corn syrup, In Figure #7 which was then visualized in the same way as the temperature and time graph presented earlier (see Figure #1, #2, #3, #4, #5) in which showed the correlation between the variables. The table shown in Figure #7 shows synthesized data with the connection between the viscosity of the corn syrup in comparison to the time as well.
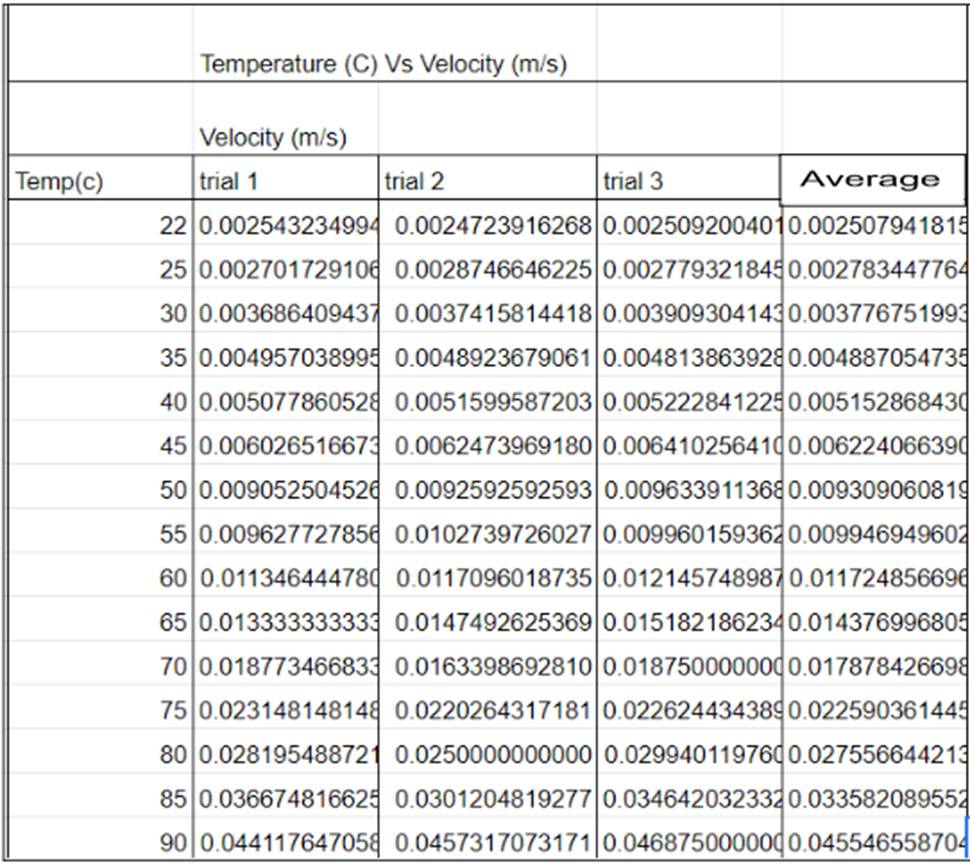
Figure #7
The resulting graph from this data correlates both to the Temperature Vs Time graph seen before (see Figure #1, #2, #3), but it also correlates with the linearization of the graph as well (see Figure #4, #5) with the slope’s being almost Identical, the N of the equation for exponential functions, with there being a slight change in the A value which can be adjusted due to the unit conversions from Time to Viscosity. These changes to find the Viscosity created extremely similar graphs with minor and negligible value differences because of several unit conversions that need to be done to get the viscosity of the syrup. To find said viscosity (see Figure #6) I had to find the density of both the corn syrup and the BB, this was just a matter of taking both Item's mass and volume into account and placing the results of those measurements into the formula

Figure #8
⍴ = (m/V) (see Figure#6) to which I
found that the BB weighed 0.35g per cubic meter ![]() with a volume of
with a volume of ![]() to
which I found the density of the BB to be
to
which I found the density of the BB to be![]() . To
find the density of the corn syrup, I followed the same steps taking the mass
of the corn syrup
. To
find the density of the corn syrup, I followed the same steps taking the mass
of the corn syrup
![]()
and then finding the volume of the test tube
![]()
resulting in a density of the corn syrup came out to be ![]() . All
of this came together when being placed into the viscosity formula, the formula
for viscosity
. All
of this came together when being placed into the viscosity formula, the formula
for viscosity ![]() (see Figure #6) uses velocity
which I also calculated by taking the distance and dividing it by the time it
took to get to the bottom of the test tube (velocity= M/S= 0.150/t).
(see Figure #6) uses velocity
which I also calculated by taking the distance and dividing it by the time it
took to get to the bottom of the test tube (velocity= M/S= 0.150/t).
Figure
8
shows the relationship between viscosity and temperature. The calculation of
this data looked something like
![]()

Ex.1

I followed through with this method through the rest of my data resulting in the graphs below (Figure #9-10)
Figure #9
Figure #10
Figure #11
When looking at the graphs you can see the immediate connection between the graphs before, the slope is the exact same, this is further supported by the linearization of the viscosity graph represented my Figure #11
Based on the data collection and description I believe there is a clear connection between the temperature of a fluid and its viscosity. With previous knowledge and research from Irish physicist Gorge G Stokes and “Stokes Equation” (Fs=6πμrv). Stoke found that viscosity was a proponent of temperature in addition to other factors, But in my evaluation, I decided to test temperature and found there is definitely a clear correlation between temperature and viscosity. You can see this best when looking at my graph, specifically my synthesized data on viscosity and its relationship to temperature (Figure #8), in the table you can see a 380 Pa*s difference over a 70-degree temperature difference directly correlating to each other as seen in my graphs of the same variables (Figure #9, #10, #11). These graphs show the exponential connection between temperature and viscosity.
The only place where Stokes’ Law doesn’t seem to hold up is with the last three data points, which presents one of the limitations of my experiment. I believe this data error or inconsistency is because the tube is too short, which causes some sort of terminal velocity to be reached or approached with these last three data points. An inconsistency that could be remedied through a lengthened test tube. This unfortunately wasn’t something that could be fixed with error bars but it doesn’t affect the results to a degree that disproves Stokes’ theorem. The human reflex aspect of the experiment is also a limitation to address with the uncertainty accounting for that but because humans cannot accurately hit the timer due to reflexes, an electric timer that tracks the ball would remedy the human error aspect of the experiment. Another limitation of the experiment is the starting accuracy because of the size of the beaker and the test tube only the fluid was able to be submerged in the warm water which required me to flip the tube out of the warm water to collect my data, which could have potentially affected the times of the data collection as well as the starting temperature when recording the time. this was luckily accounted for with the error bars because of the differences in time. This could be remedied if the fluid was controlled in a way that allowed it to stay completely submerged and give very specific points to which the BB would interact, and example of this could be if the BB fell past one line to which the timer started and then traveled a set distance to which it would interact with a separate line and then stop the timer to get more accurate data.
The experiment could have been improved on in many ways but it's in relation to being able to control the submerged object making sure it's completely submerged the entire time potentially with the use of a large container like a bucket as well as constant monitoring of the temperature of the corn syrup. If we could also address the human error component of timing and have an electric timer triggered by the BB itself rather than human reflexes the experiment would be significantly more accurate. If the Length of which the ball falls is also adjusted the experiment would be significantly more accurate allowing for the 3 drifted points in my graph to line up with the graph better. The issue with flipping the tube and its relation to the experiment could be remedied by using a magnet to raise the ball to its drop point rather than flipping the tube to reset the experiment.
“Stokes' Law.” Wikipedia,
Wikimedia Foundation, 26 Nov. 2022, https://en.wikipedia.org/wiki/Stokes%27_law
“Viscosity.” Encyclopædia
Britannica, Encyclopædia Britannica, Inc., 10 Feb.
2023, https://www.britannica.com/science/viscosity
https://en.wikipedia.org/wiki/Stokes%27_law :
this wiki page goes over the basics of Stokes’ law as well as where it was derived from. It was very beneficial in rounding out the information of my IA and fixing errors as well as leading me to find more interesting things about stokes law, and even more about George G. Stokes as well.
https://www.britannica.com/science/viscosity
:
This
link sends you directly to the definition of viscosity to help you (and myself)
understand exactly what viscosity is and how to apply it in our everyday lives.
https://en.wikipedia.org/wiki/Corn_syrup
:
This is the link to the Corn syrup Wikipedia page. This link is very useful in
regards to this experiment because it’s the main substance and the main focus
of the experiment. Although the website doesn’t talk about way that corn syrup
behaves under intense temperatures, It does however
explain the differences between different types of corn syrup; being Light corn
syrup and dark corn syrup and their uses as well as the preservatives in both.
The Wikipedia page also touches on the monopoly that the corn syrup brand “Karo” has on the industry since the early 1930s’controlling
the entire market with cut throat business practices and outlandish prices in
the ranges of 5-7 dollars per every 16 ounce bottle.
https://www.britannica.com/biography/Sir-George-Gabriel-Stokes-1st-Baronet :
this is a link to the Britannica page on George G Stokes, or the man responsible for the Stokes law and a lot of what we know today about fluid mechanics. The website goes into detail about his early life as well as mentioning and detailing information on other physicists related to fluid mechanics.