Relationship between Drop Height and a Ping-Pong ball’s Half-Life while Bouncing
IB Physics IA
Brandon Dupreez
Word Count: 1606
Table of Contents: Return to Research
As a kid, I was
always interested in mathematical puzzles. For me, the focus was always on the
puzzles themselves and the methods used to solve them. It was this part that
always fascinated me the most. One of these formulas was the power function.
This function can be found throughout physics, with some examples being
acceleration, periods of oscillators, escape velocity, and SUVAT derived
equations. My project asks; At what rate will a ping-pong ball bouncing on a
table lose energy and will it lose energy at a constant rate. Due to the fact
that the ball’s energy is proportional to how high it bounces, I believe that
increasing the drop height will decrease the rate at which the ball loses
energy. As the drop height increases, the potential energy stored in the ball
would increase, thus making the amount of time that passes between the first
and fifth bounces larger as well. I assume that
an increase in drop height would cause this effect.
The values calculated from this experiment were times when the ball bounces on the surface for the first and fifth times as well as how high the ball bounced on its first and fifth bounces. The bounce times are measured in seconds while the height is measured in centimeters. The ball is dropped from heights ranging from 5 to 100 centimeters above the surface. Each drop height is given 3 trials. Then, taking the average of these three trials for both the first and fifth drop heights, I will subtract the latter from the former to find the average time between the two. This should allow me to find if the rate of decay is constant or not. A simple meter stick will help me measure the distance, while a microphone hooked up to a computer will gather the data for me. The acceleration of gravity and the weight of the ping pong ball will remain constant regardless of my intervention or not. Likewise, I can’t see any possible safety concerns that could arise from this project. I chose the amount of trials and variations I did because it made it easy to measure with a meter stick and because it was enough to account for possible deviations inherent to each individual trial.
Independent Variable: Drop height (in meters)
Dependent Variable: The Average Time Between the Fifth and First Bounces
Constants: Acceleration of Gravity, Weight of Ping-Pong Ball
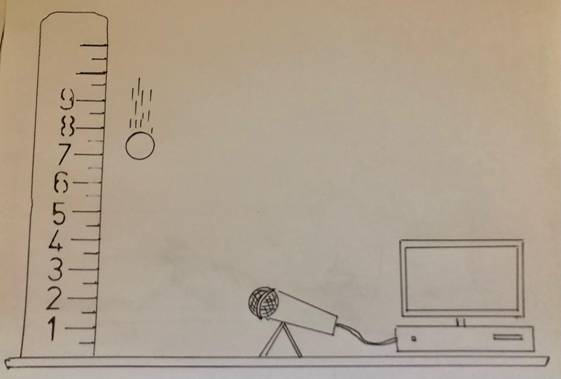
Objects in Diagram:
Ping Pong Ball
Meter Stick
Microphone
Table
Computer
Data Collection Example:
|
|
|
First |
Bounce |
Time |
|
|
|
Fifth |
Bounce |
Time |
|
|
Height (m) |
|
|
Time in Seconds |
|
|
Height (m) |
|
|
Time in Seconds |
|
|
|
(+/-0.1ccm) |
Trial One |
Trial Two |
Trial Three |
Average |
Uncertainty |
(+/-0.1m) |
Trial One |
Trial Two |
Trial Three |
Average |
Uncertainty |
|
5 |
0.0756 |
0.1176 |
0.1360 |
0.1097 |
0.0302 |
5 |
0.0875 |
0.8834 |
0.9286 |
0.6332 |
0.4206 |
|
10 |
0.0736 |
0.2320 |
0.1964 |
0.1673 |
0.0792 |
10 |
1.1000 |
1.2550 |
1.2120 |
1.1890 |
0.0330 |
|
15 |
0.3152 |
0.2776 |
0.1680 |
0.2536 |
0.0736 |
15 |
1.5200 |
1.4730 |
1.3840 |
1.4590 |
0.0445 |
|
20 |
0.0256 |
0.2518 |
0.0272 |
0.1015 |
0.1131 |
20 |
1.4890 |
1.6150 |
1.4640 |
1.5227 |
0.0755 |
|
25 |
0.0848 |
0.0132 |
0.1518 |
0.0833 |
0.0693 |
25 |
1.6880 |
1.5740 |
1.7330 |
1.6650 |
0.0795 |
|
30 |
0.1876 |
0.4394 |
0.3254 |
0.3175 |
0.1259 |
30 |
1.7870 |
2.0330 |
1.9140 |
1.9113 |
0.0609 |
|
35 |
0.2700 |
0.4624 |
0.0290 |
0.2538 |
0.2167 |
35 |
1.9210 |
2.1010 |
1.8310 |
1.9510 |
0.1350 |
|
40 |
0.0978 |
0.2946 |
0.4096 |
0.2673 |
0.1559 |
40 |
1.9710 |
2.0170 |
2.1390 |
2.0423 |
0.0610 |
|
45 |
0.0840 |
0.4832 |
0.5232 |
0.3635 |
0.2196 |
45 |
2.0440 |
2.2710 |
2.3170 |
2.2107 |
0.0532 |
|
50 |
0.0792 |
0.2922 |
0.0938 |
0.1551 |
0.1065 |
50 |
2.1000 |
2.3190 |
2.1240 |
2.1810 |
0.0975 |
|
55 |
0.1862 |
0.1306 |
0.0914 |
0.1361 |
0.0474 |
55 |
2.2970 |
2.2110 |
2.1960 |
2.2347 |
0.0194 |
|
60 |
0.1048 |
0.1282 |
0.1524 |
0.1285 |
0.0238 |
60 |
2.2870 |
2.2910 |
2.3270 |
2.3017 |
0.0180 |
|
65 |
0.0952 |
0.1332 |
0.1302 |
0.1195 |
0.0190 |
65 |
2.3210 |
2.3710 |
2.3660 |
2.3527 |
0.0092 |
|
70 |
0.1112 |
0.3682 |
0.1566 |
0.2120 |
0.1285 |
70 |
2.4270 |
2.7070 |
2.4410 |
2.5250 |
0.1330 |
|
75 |
0.1068 |
0.1408 |
0.1392 |
0.1289 |
0.0170 |
75 |
2.4490 |
2.4680 |
2.4920 |
2.4697 |
0.0120 |
|
80 |
0.1822 |
0.1592 |
0.1604 |
0.1673 |
0.0115 |
80 |
2.5820 |
2.5640 |
2.5530 |
2.5663 |
0.0067 |
|
85 |
0.2144 |
0.1950 |
0.2946 |
0.2347 |
0.0498 |
85 |
2.6690 |
2.6410 |
2.7340 |
2.6813 |
0.0465 |
|
90 |
0.2732 |
0.2016 |
0.2982 |
0.2577 |
0.0465 |
90 |
2.7720 |
2.6990 |
2.8030 |
2.7580 |
0.0520 |
|
95 |
0.2708 |
0.2314 |
0.1734 |
0.2252 |
0.0487 |
95 |
2.7850 |
2.7610 |
2.6870 |
2.7443 |
0.0370 |
|
100 |
0.4094 |
0.2196 |
0.2622 |
0.2971 |
0.0949 |
100 |
2.9790 |
2.8050 |
2.8350 |
2.8730 |
0.0340 |
|
|
Difference |
Between Fifth And |
First Bounces |
|
|
|
|
Time in Seconds |
|
|
|
Trial One |
Trial Two |
Trial Three |
Average |
Uncertainty |
|
0.0119 |
0.7658 |
0.7926 |
0.5234 |
0.39034 |
|
1.0264 |
1.0230 |
1.0156 |
1.0217 |
0.0054 |
|
1.2048 |
1.1954 |
1.2160 |
1.2054 |
0.0056 |
|
1.4634 |
1.3632 |
1.4368 |
1.4211 |
0.0368 |
|
1.6032 |
1.5608 |
1.5812 |
1.5817 |
0.0212 |
|
1.5994 |
1.5936 |
1.5886 |
1.5939 |
0.0054 |
|
1.6510 |
1.6386 |
1.8020 |
1.6972 |
0.0817 |
|
1.8732 |
1.7224 |
1.7294 |
1.7750 |
0.0754 |
|
1.9600 |
1.7878 |
1.7938 |
1.8472 |
0.0861 |
|
2.0208 |
2.0268 |
2.0302 |
2.0259 |
0.0047 |
|
2.1108 |
2.0804 |
2.1046 |
2.0986 |
0.0152 |
|
2.1822 |
2.1628 |
2.1746 |
2.1732 |
0.0097 |
|
2.2258 |
2.2378 |
2.2358 |
2.2331 |
0.006 |
|
2.3158 |
2.3388 |
2.2844 |
2.3130 |
0.0272 |
|
2.3422 |
2.3272 |
2.3528 |
2.3407 |
0.0128 |
|
2.3998 |
2.4048 |
2.3926 |
2.3991 |
0.0061 |
|
2.4546 |
2.4460 |
2.4394 |
2.4467 |
0.0076 |
|
2.4988 |
2.4974 |
2.5048 |
2.5003 |
0.0037 |
|
2.5142 |
2.5296 |
2.5136 |
2.5191 |
0.008 |
|
2.5696 |
2.5854 |
2.5728 |
2.5759 |
0.0079 |
Data File:.Excel
Data File:.Excel
For the data, I chose to take three trials for each drop height before finding their average and uncertainty. Following this, I subtracted the times of the first bounce from the times of the fifth bounce and found their average and uncertainty, providing me with the data I’ll use for my graph.
As an example: I got times of 0.0756, 0.1176, and 0.1360 for my three trials at five centimeters of height (first bounce) and times of 0.0875, 0.8834, and 0.9286 for my three trials at five centimeters of height (fifth bounce). The average of the former is 0.1097 and the latter, 0.6332. Subtracting 0.1097 from 0.6332 will give me an average difference of 0.5235.
In order to prove my hypothesis that the
difference will increase at a non linear rate, I will used the equation ![]() , an equation derived from the SUVAT based equation. S=
, an equation derived from the SUVAT based equation. S=![]()
a = Acceleration of
Gravity (![]() )
)
s = Drop Height (5-100 cm)
t = time (Seconds)
Solving for t then gives us
h = ![]()
2h = ![]()

Plugging the values given for h and g into this formula gives us
![]()
The graph created from this is a square root graph, just like the raw data graph derived from my experiment, proving that my guess was correct.
The data gathered confirms that the graph does increase overtime at a
non-linear rate. Proof of this is that the graph is also a square root graph,
just like the graph predicted using the equation![]() . The
deviations in my data were likely caused by the ball frequently drifting to the
side while falling, causing it to bounce out of the detection range of the
microphone or for the ball to collide with the microphone, ruler or other
objects on the table. Furthermore the measurement of how high the ball was
dropped and measured by hand, which resulted in the wide error margins seen in
my graphs. To alleviate these basic flaws, I would use a modified tube to
prevent the ball from moving in any direction but vertically and use a more
precise way to decrease the range of error in the drop height. These simple
changes should be enough to eliminate the largest sources of error. If I was to
conduct this experiment again, I would redo the experiment with other bouncing
objects of different mass and density to see if they also follow similar
mathematical patterns.
. The
deviations in my data were likely caused by the ball frequently drifting to the
side while falling, causing it to bounce out of the detection range of the
microphone or for the ball to collide with the microphone, ruler or other
objects on the table. Furthermore the measurement of how high the ball was
dropped and measured by hand, which resulted in the wide error margins seen in
my graphs. To alleviate these basic flaws, I would use a modified tube to
prevent the ball from moving in any direction but vertically and use a more
precise way to decrease the range of error in the drop height. These simple
changes should be enough to eliminate the largest sources of error. If I was to
conduct this experiment again, I would redo the experiment with other bouncing
objects of different mass and density to see if they also follow similar
mathematical patterns.
Since my project
required little prior research to complete, these links go to sites containing
mundane details about Ping pong balls. The Bottom two link to other, more
advanced studies on similar topics to my project.
Gives a brief
history of how ping-pong balls and table tennis were invented.
A basic
experiment that compares the elasticity
of various types of balls (including ping-pong balls)
https://easyscienceforkids.com/ping-pong-balls-video-for-kids/
A small
collection of fun facts about ping-pong balls and table tennis.
Another IA on
the same topic I did
https://www.markedbyteachers.com/gcse/science/the-bouncing-ball-experiment.html
Another experiment
covering bouncing ping-pong balls.