Determining the Relationship between the Salinity of a Medium and its Optical Index of Refraction.
IB Physics IA
By: Benjamin Wyland
Word Count: 2116
Table of Contents
Introduction
Background Information
Salts possibly could be one of the most famous flavor agents and utilitarian minerals known to common man. The history of salt’s use in civilization is relatively significant as it presented both a nutritional necessity for human survival, as sodium ions help the body perform a variety of functions, along with providing the ability for human to cure foods, making refrigeration unnecessary, and not to mention the cultural impacts such as mummification in ancient Egypt (Butler, 2013). Salt even had a significant impact on the more modern age as during the Civil War salt was precious as it was used for tanning leather, dyeing clothes and preserving troop rations, leading to Confederate President Jeffereson Davis to offer a military service waiver to anyone who would work salt production (Butler, 2013).
Now, in our day and age, it is difficult to find a meal or dish that does not contain salt in some capacity, may it be used as a rub for meat products or used to add flavor to soups and vegetables, and along with the distinct differences between bodies of freshwater and the water in the ocean, it’s unsurprising that there has been a specific measure developed to observe the concentration of salt in a liquid, salinity. Absolute salinity is defined by the amount of mass of dissolved salts in seawater, brackish water, brine, etc. per mass or the solution, measured in g per kg (gkg-1), typically denoted by the symbol “‰” (Turekian & Holland, 2013). Typically, salinity is not measured directly, but evaluated by measuring another physical parameter that salinity affects, such as density, specific gravity, electrical conductivity, optical refraction index, etc (Turekian & Holland, 2013). Incidentally, optical refraction index is one of the more simple measures, only requiring rudimentary instruments and seemingly would not require pertinent accuracy, note that the index of refraction for sodium chloride, a common salt, is approximately 1.54 (Stupar 2012).
Optical refraction index indicates the amount of refraction light undergoes as it transitions between different speed mediums, and in this transition the light bends towards the normal to the boundary (Nave, n.d.). This bending can be visualized by Huygens’ principle, which describes the index of a medium to be inversely proportional to the velocity of light in a medium,  , along with Snell’s law, which can define the refractive index of a medium by referencing a known one by relating the ratio of the indices to their angles of refraction,
  (Nave, n.d.). Along with these considerations, density and viscosity of a medium affect the index of refraction, for as these values increase it reduces the speed of light within the medium, and by proxy the index of refraction, which brings to reason as well that temperature plays a more significant roles as it affects both viscosity and density (Chemistry Online @ UTSC, n.d.). This can be correlated to the added density of a sodium chloride solution, as this salt has a density of 2170 kg/m3 compared to water’s density of 997 kg/m3, meaning that by increasing the concentration of sodium chloride in a solution, it would increase the density thereby increasing the index of refraction. Moreover, the index of refraction of sodium chloride is 1.54, meaning this index would be in greater consideration as its concentration increases.
Research Question
The purpose of this investigation is to determine the effect the salinity of water has upon the refractive index of the water. Salinity is defined as the amount of salt in the solution per unit of water. The refractive index of the water is defined as the relationship between the actual and refracted image of an object through the medium.
Variables
In this investigation the salinity of the water is the independent variable, the measured index of refraction is the dependent variable. The control variables are the volume and temperature of the water, width of the rod used for measuring, and the volume of the beaker.
Hypothesis
We believe that the resultant data from this investigation will depict a positive relationship between the salinity of the water and its measured refractive index, and predict that it would possess a positive linear relationship due to the linearity of concentration and salt’s tendency to create homogeneous mixtures, resulting in a steady increase in refractive index as more salt molecules affect incoming light.
Methodologies
Materials
- Water: 600 mL of water.
- Salt: 60 g. Enough salt to raise the salinity of the water provided above to 100 g/kg (L and kgs are equal for room temperature water).
- Beaker: 1 L; holds the saline water.
- Cardboard Guide: a circle of cardboard with the diameter of the beaker that has a guide cut out with a width of the diameter of the rod.
- Rod: its refracted image will be used to gather data and determine the index of refraction.
- First Ruler: Used to keep the different distances from the center of the beaker constant for each trial.
- Second Ruler: Used to measure the refracted image of the rod in the saline water.
- Camera: to take accurate measurements from the same angle.
- Scale: For measuring the mass of the salt.
- Weight Boat: For measuring the salt.
- Scapula: For measuring the salt.
Diagrams of Setup
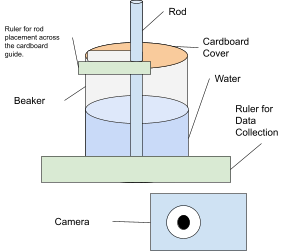
Diagram 1
Diagram of Setup
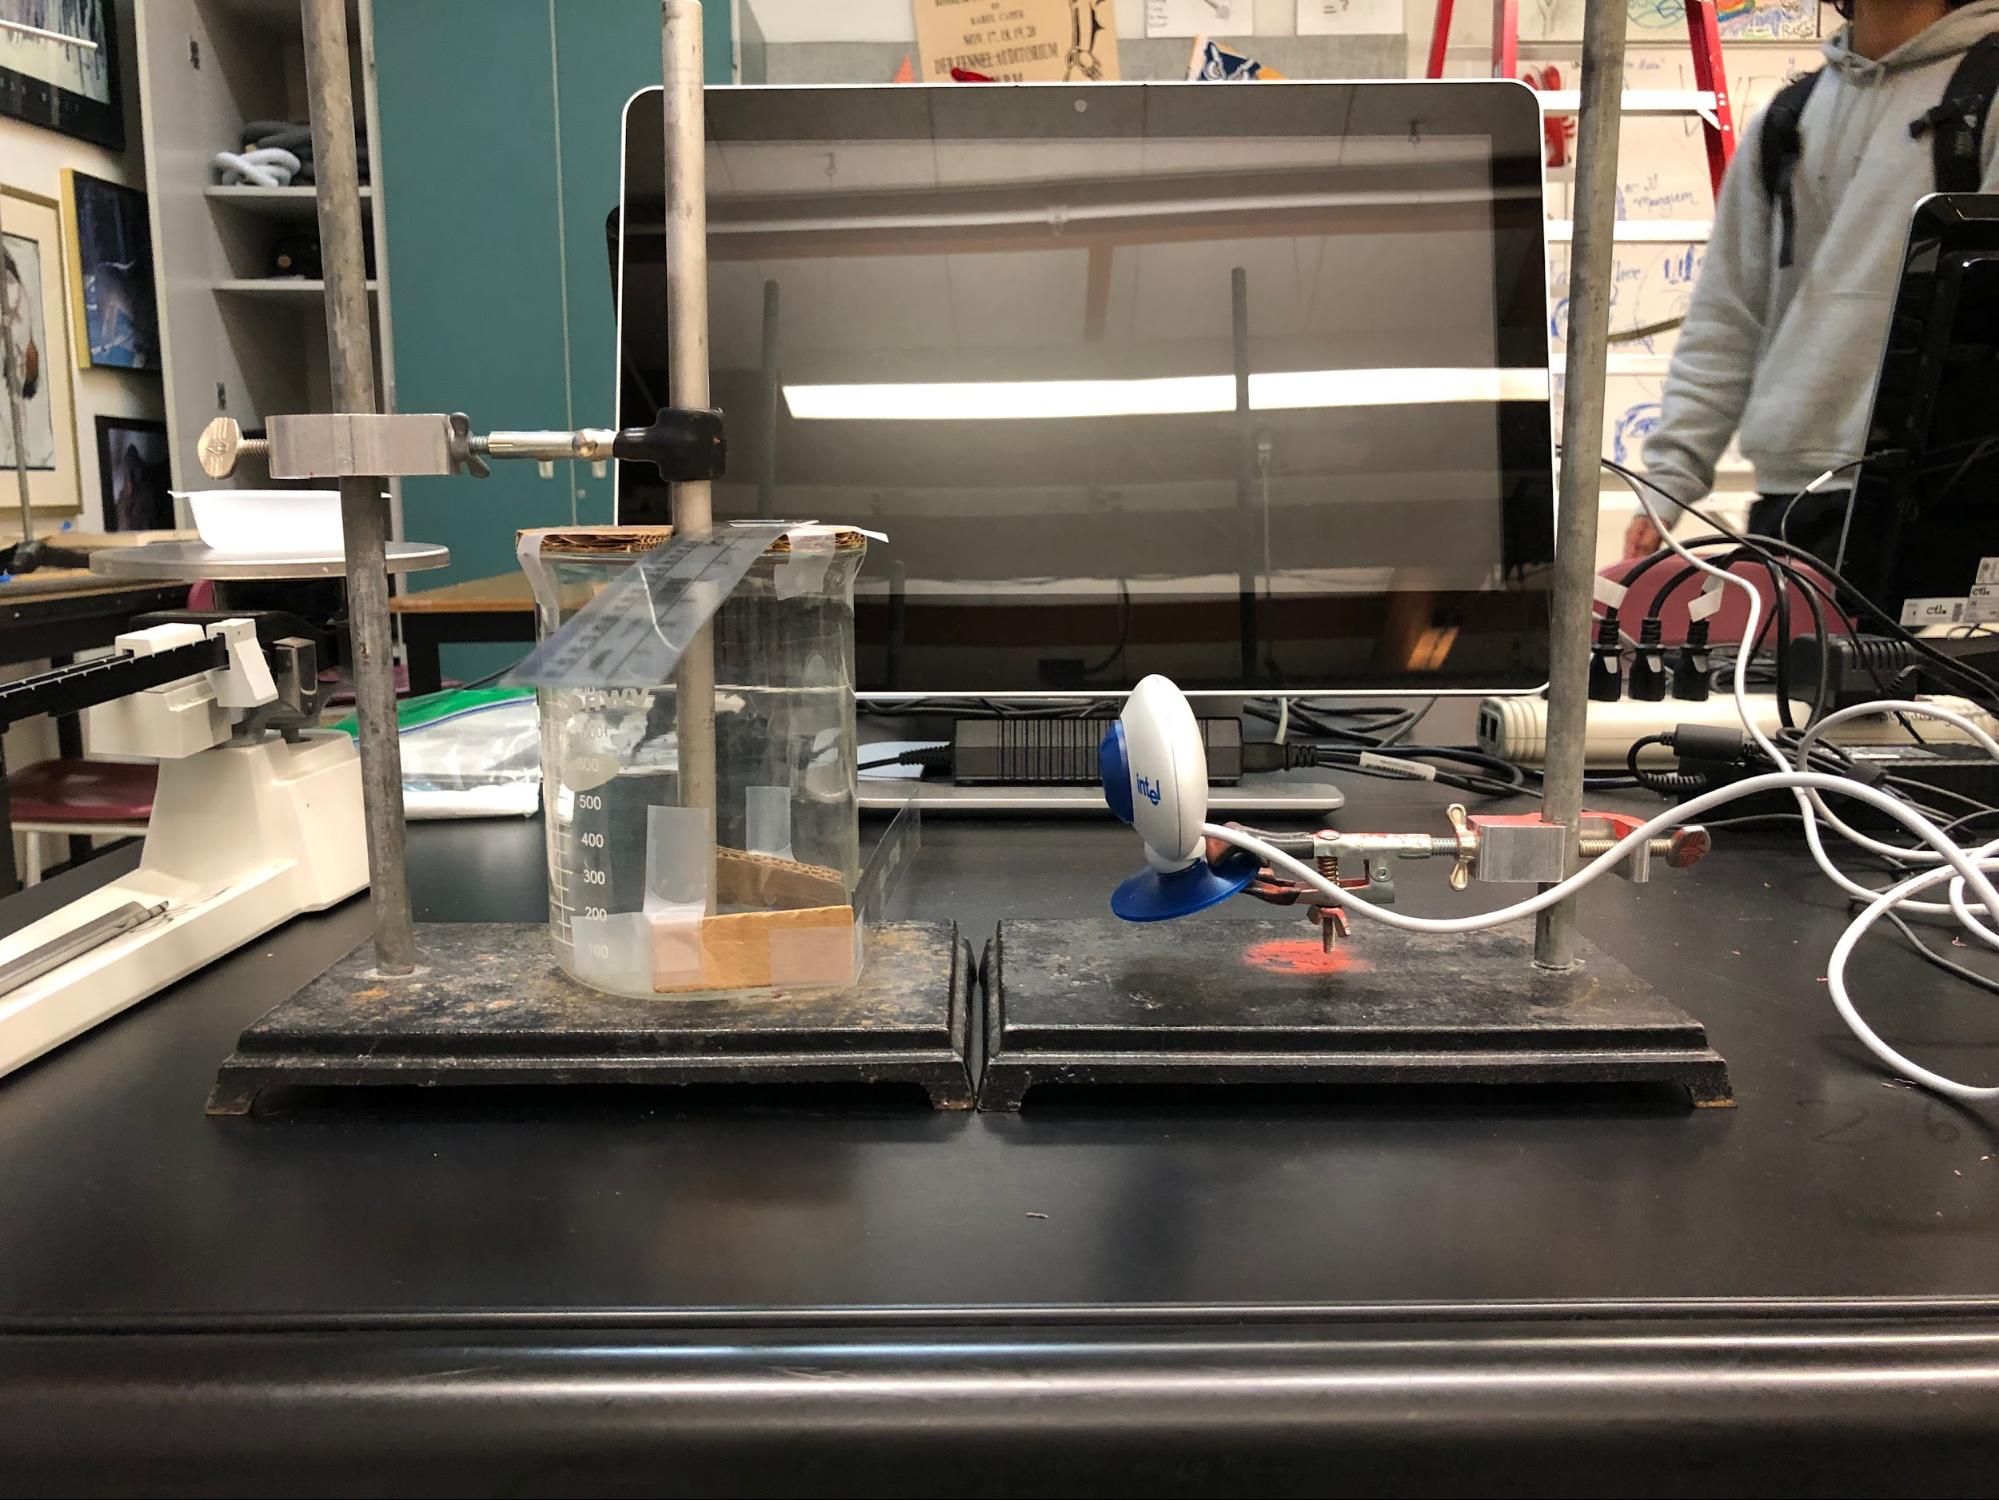
Photograph 1
Photograph of Setup
Procedure
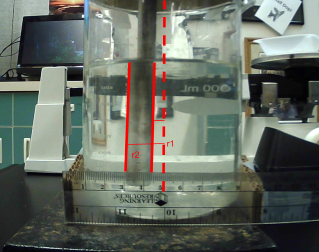
To begin, a cardboard circle was cut to a size so that it could cover the beaker, then cut a path from the center to the edge with the diameter of the rod so that the rod can slide snugly from the center to the edge. Fill the beaker with the 600 mL, make sure the water is room temperature by waiting enough time and using a thermometer, and tape the cover on top of the beaker, then insert the rod and fix the camera in the desired positions, preferably fasten them to a solid structure that would limit movement, and make sure the camera stays in line with the rod. First, take the first picture with the rod in the center and then take 3 more pictures with the rod at three different predefined distances from the center of the beaker. Then to increase the salinity of the water add 6 g of salt into the water and mix the salt until all particulates have dissolved and mix for 1 minute afterwards. Repeat the picture taking step for each addition of 6 g of salt, with the same mixing procedure, until the total amount of salt added to the beaker equals 60 g. In total there would be 4 trials (center, 1 cm, 2 cm, 3 cm away) for each of the 11 variations of salt concentrations with the addition of 6 g for one (0 g, 6 g, 12 g, 18 g…48 g, 54 g, 60 g). These variations were decided due to the fact that the salinity of ocean salt water is roughly 30 g/kg, so this range gives a good picture of this, and the trial specifications were chosen as it helps eliminate variation from perspective by averaging measurements from these perspectives. From the pictures the distance from the far side and near side of the rod to the center of the refracted image of the rod is determined by using the ruler as a reference. Example in photograph 2 from the second trial of the 18 g concentration.
Photograph 2
Image analysis of Data Point Trial 2 of 18 g/kg
From the data collected and the definitions defined in the introduction, one can formulate to model the refractive index of a medium by inserting a rod into a beaker of liquid and measuring the difference of the distance of the rod, and its refracted image, from the center of the beaker,  , where n is the refractive index, d the diameter of the rod, and r indicating the distances from the center both near and far (Gluck, 2011). Some ethical or safety consideration for this investigation are that it's possible that someone could falsely consider the water used in the experiment to be potable and drink it, leading to discomfort and a large dose of sodium, and an ethical consideration of this experiment is the sourcing of the sodium chloride and whether or not it was collected and processed in a manner that was ethical to the workers and the possible pollution that could be caused by this excess use of water and salt going to waste.
Data Analysis
Raw Data
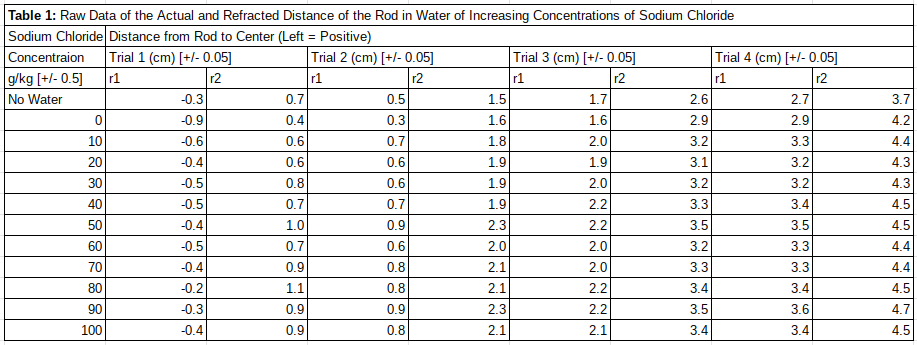
In table 1 the raw data gathered from the experiment is displayed. The data is split into each trial, for each distance increment, for each salinity concentration of sodium chloride. The r1 represents the distance from the center to the right side of the rod (negative numbers indicate distance to the left of the center) and r2 represents the distance from the center to the left side of the rod. The No Water row was used to get a baseline of the index of refraction of the beaker without the water (Note: this value is not included in graphical representations as it is irrelevant to the tested relationship). Moreover, a graphical representation of the raw data will not be included as it would provide no value to this investigation and would only obfuscate the results, due to the distances being unable to be averaged, the other method would be plotting each individual point which would not help in comprehension, and plotting the differences would be indistinguishable to the processed data due to factors explained later.
Table 1
Table of Raw Data
Data Excel File Data text File
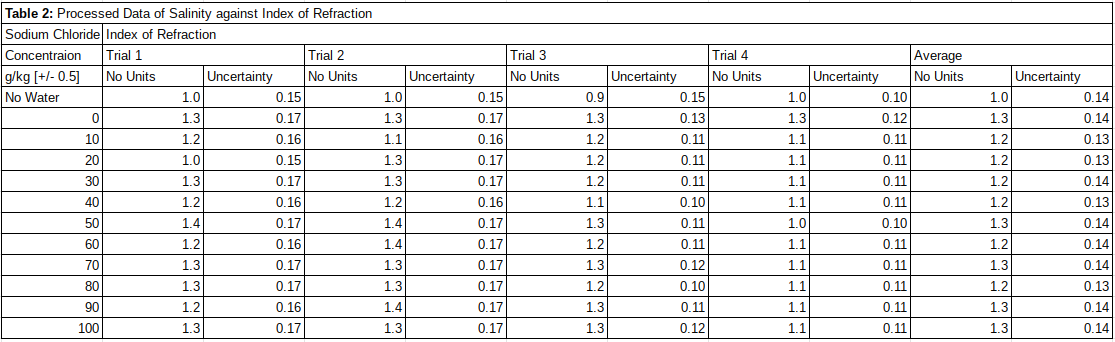
Processed Data
In table 2 the calculated index of refraction from the raw data shown above. These values are calculated by using the formula , which was stated in methodologies, where n represents the index of refraction and d the actual diameter of the rod, which makes out to be only 1 cm. Due to the unitary nature of the rod’s diameter, this simply works out to be the difference of the two values, or more simply the observed diameter of the rod through the water.
Example: (10 g/kg, Trial 1)

The individual uncertainties are calculated by adding the uncertainties of the two values then adding the fractional uncertainties of the difference and of the diameter.
Example: (10 g/kg, Trial 1)

Averages of both the values and uncertainties were found by simply averaging the calculated values and uncertainties in each variation.
Table 2
Table of Processed Data
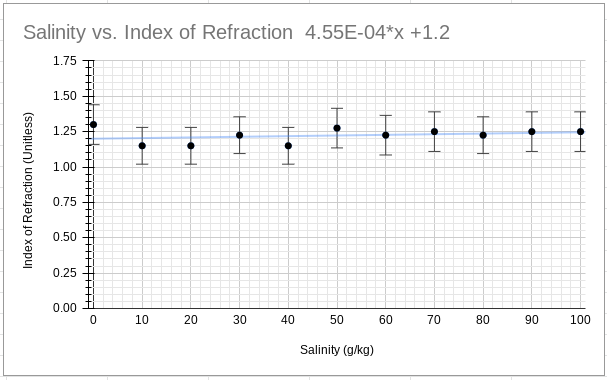
Graph 1 graphically shows the average index of refraction for each variation and its uncertainty with a trendline that loosely matches the data.
Graph 1
Graph of Processed Data and Trendline
Graph 2 graphically demonstrates the maximum and minimum values for the slope of the trendline by fitting it between the extremes of the uncertainties. Trendline equations are recognizable by color.
Graph 2
Graph of Processed Data with Maximum and Minimum Slope
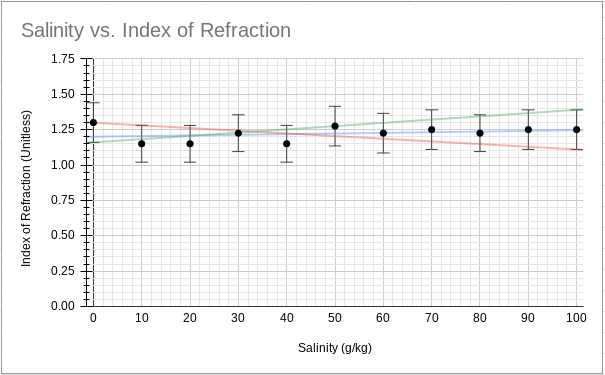
2.3E-0.3*x+1.16 4.55E-04*x+1.2 -1.89E-03*x+1.3
Thereby, the slope, and its uncertainty, of the trendline can be calculated to be 4.55x10⁻⁴ ± 2.095x10⁻³.
Conclusion
From the data collected in the experiment, one can conclude that the relationship between the index of refraction to salinity is linear and is demonstrated by the slope 4.55x10⁻⁴ ± 2.095x10⁻³ [kg/g], meaning for each unit of salinity the index of refraction would increase by the value above. Certainly, this affirms my hypothesis made in the introduction above as it clearly demonstrated the same positive linear relationship that was predicted in the introduction, and could easily be attributed to the fact that in ideal solutions physical properties are aggregated in a linear combination leading to the addition of salt correlating with an addition of refractive index. Moverover, the literature value for this relationship has been measure to be 1.7x10⁻³ [kg/g], relating index of refraction to salinity, or concentration of sodium chloride in a solution (Tengesdal, 2012), which easily fall within the uncertainty range of the value; however, there are incredibly important considerations to be made, as evidently, the uncertainty of the measurements are quite large, and large enough to bring the slope down into the negatives, invalidating our conclusion. This uncertainty can be directly related to the relative lack of precision of the rulers used in the experiment, as they were incapable of accurately and consistently measuring a change in the width of the refracted image, so that the very miniscule change would be noticeable, as evident by the fact that the slope is within the range of the uncertainty. A way to eliminate this uncertainty would be to use an image analysis program that could analyze the images more precisely, reducing the uncertainty of the measurements, or one would employ a method that include measuring the angle of a laser transitioning into the water and using Snell’s Law to determine the index of refraction, but one would still have to have a considerably precise measurement of angle. Another consideration would be the relatively lower than expected y-intercept of the trend line as this should represent the index of refraction of water, which in the variation without salt measured to be 1.3, exactly the literature value. Therefore, for some unknown reason the data collected deviated downwards after the first two controls before continuing upwards, one can rule out the beaker causing significant error as both controls for air and pure water gave their respective literature values for index of refraction, and I would have to rule this out as a deviation in my setup that must have occurred between 0 g/kg and 10 g/kg, so this calls for the need to replicate this experiment again and verify if this deviation is due to setup error or an actual occurrence due to salinity. For future research, one could test the effects of increasing concentrations of different types of salt (potassium chloride, calcium chloride, etc.) to investigate the different index of refractions of these different salts.
Links
sciencedirect.com/topics/engineering/index-of-refraction
More Indepth Information Regarding Index of Refraction.
A Study About the Remote monitoring of water salinity by using side-polished fiber-optic U-shaped sensor, which uses Index of Refraction as one of its key principles.
Talks about the Index of Refraction of Seawater and Freshwater as a Function of Wavelength and Temperature, so that one can gain a better understanding of the different factors of refraction.
Talks about the Effect of Ocean Salinity on Climate and Its Implications for Earth's Habitability. An environmental perspective on the salinity of water.
Talks about the Index of Refraction and how it relates to the Color of the Ocean.
References
Butler, S. (2013, January 10). Off the Spice Rack: The Story of Salt. Off the Spice Rack: The Story of Salt. Retrieved February 5, 2023, from https://www.history.com/news/off-the-spice-rack-the-story-of-salt
Chemistry Online @ UTSC. (n.d.). Chemistry Online @ UTSC. Retrieved February 12, 2023, from https://www.utsc.utoronto.ca/webapps/chemistryonline/production/refractive.php
Gluck, P. (2011). A simple method to measure the refractive index of a liquid. Physics Education, 46(3), 253-254. 10.1088/0031-9120/46/3/F06
Nave, R. (n.d.). Refraction of Light. Hyperphysics. Retrieved February 5, 2023, from http://hyperphysics.phy-astr.gsu.edu/hbase/geoopt/refr.html
Tengesdal, O. (2012, May). Measurement of seawater refractive index and salinity by means of optical refraction [Thesis]. Department of Physics and Technology University of Bergen. https://core.ac.uk/download/pdf/30925131.pdf
Turekian, K. K., & Holland, H. D. (Eds.). (2013). Treatise on Geochemistry. Elsevier Science. https://doi.org/10.1016/B978-0-08-095975-7.00718-X