Rachel McWhirter
Nicole Arnan
Investigating the Effect of Volume of Water on the Frequency
of a Resonating Wine Glass
Table of Contents: Introduction .:. Method .:. Results .:. Conclusion .:. Bibliography .:. Related Websites .:. Go Up
Background
In today’s age, the most common use for wine glasses is obviously to hold wine, but they can also be used to make music. Comprised of upright wine glasses, the glass harp was invented around 1750 and served as the basis of inspiration for Benjamin Franklin’s glass harmonica (Buddies). In order to make different pitches, the amount of water would be uniquely adjusted for each glass, and the musician would rub his/her wet finger along the rims of the different glasses. This phenomenon is commonly referred to as “singing wine glasses” or “glass harp” (Szafraniec).
There are several physics concepts that explain the mystery behind singing wine glasses. Resonance is the point where the forced vibration from an external force is equal to the natural frequency of the system (Giancoli 287). Resonant frequency is the naturally occurring frequency of the object (Resonance). Rubbing a wet finger against the wine glass produces forced vibrations onto the system, causing friction that moves the sides of the glass to move in and out; this movement then moves the air in the glass which results in a musical pitch. As pressure from the finger is applied along the rim, “the sides of the glass move in and out, a pattern that moves the air in the glass, propagating a wave of sound” (Becker). These waves of sound have unique frequencies, or how fast the wave moves up and down, that determine the pitch.
Adding more water to the glass lowers the pitch, because the water makes the glass more massive. This means that it takes more energy to move, so the sound wave will move more slowly with a lower frequency.
In 1983, A.P. French derived a mathematical formula to illustrate the relationship between the resonant frequency of a wine glass and the height of the water level inside (French). He found that if a glass was cylindrical, the relationship would be a perfectly linear line. However, he also found that the formula worked approximately for other cylindrical objects like wine glasses. French’s findings will confirm our hypothesis of a negative correlation between water volume and resonant frequency.
Statement of the Problem
The purpose of this investigation is to determine the effect that the volume of water inside a wine glass has on its resonant frequency.
Hypothesis
If the volume of water in a wine glass is increased, then the frequency at which the glass resonates will decrease since the increased mass requires more energy to move. If the relationship between the independent variable (volume of water in the glass in mL) and the dependent variable (frequency of resonating glass in Hz) is graphed, the resulting line would appear to be linear. Controlled variables include shape of the wine glass, temperature of the room, and temperature of the water.
Method.:. Go Up
Materials
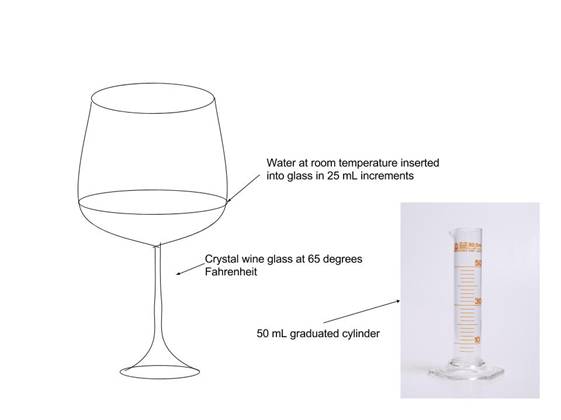
- Crystal wine glass (same one for all trials)
- 50 mL graduated cylinder
- Water
- Electronic tuner (measures frequency in Hz)
Procedure
Wet finger was rubbed around an empty wine glass until it produces a “singing” tone. The resulting tone was recorded by holding an electronic tuner close to the glass until the frequency could be recorded. The electronic tuner used was an application “Pitched-Tuner” which measures frequency to the tenth place through the built in microphone of a cell phone. 25 mL of water at room temperature was measured in a graduated cylinder and added to the glass. Wet finger was rubbed around the glass to produce a tone. Frequency was recorded. Water was added in 25 mL increments until 300 mL, frequency was recorded for 13 increments. Glass was dried before each trial. Process was repeated for four trials to obtain accurate results. The room temperature was constant at 65 degrees Fahrenheit.
Diagrams
Application used to measure frequency: “Pitched-Tuner”
Results.:. Go Up
Processed Data
|
Volume of Water (+/-0.5 mL) |
Average Frequency across 4 Trials (Hz) |
Uncertainty of Frequency (Hz) |
|
0 |
1325.55 |
0.75 |
|
25 |
1319.175 |
11.35 |
|
50 |
1319.15 |
5.75 |
|
75 |
1319.825 |
4.2 |
|
100 |
1306.55 |
22.1 |
|
125 |
1299.875 |
16 |
|
150 |
1275.125 |
21.9 |
|
175 |
1249.2 |
8.3 |
|
200 |
1202.625 |
43.95 |
|
225 |
1190.875 |
23.7 |
|
250 |
1126.475 |
6.8 |
|
275 |
1098.825 |
20.95 |
|
300 |
1038.8 |
12.5 |
Graphs
Enlarged graph (y-axis does not start at origin) with error bars and quadratic trend line
Graph with entire y-axis shown
Conclusion.:. Go Up
The results of our experiment demonstrate that as water volume is added to the wine glass, the resonant frequency of the glass decreases. Our hypothesis predicted a decrease in resonant frequency as water volume rose, which is supported by our findings. However, upon analyzing our line of best fit, we deduced that indeed the trend is not linear but quadratic, negating the statement in our original hypothesis that the data would have a linear correlation. French found a perfect linear relationship between resonant frequency and height of water level in cylindrical objects, but the independent variable of French’s experiment was height of water level, while the independent variable for our experiment was volume. The difference in the manipulated variables explains why our hypothesis was not supported, and why our trend line does not appear linear. Additionally, our wine glass is not quite a cylinder, and that may have influenced our results.
The general explanation for the decaying nature of our graph is that as more water is added to the glass, more energy is required to move it because it is more massive. The vibrations of a more massive object are slower and have a lower frequency, which makes the pitch sound lower to the ear. As the graph shows, the frequency of the pitch changes slowly at first, then much more quickly. A possible explanation for this parabolic nature of our graph may be that the frequency changes depending on the percentage of water filled. To explain, the capacity of our glass was about 320 mL. This means that in a glass with 50 mL inside, adding 25 mL more means that only about 9% of the empty capacity of the glass was filled (320-50=270. 25/270=0.09). However, adding 25 mL to a glass with 275 mL inside means that the added 25 mL takes up much more of the empty capacity left in the glass (320-275=45. 25/45=56%). Because the added 25 mL comprises of a much larger percentage of the empty capacity of the glass when the glass is more full, the frequency changes more dramatically. In other words, the added 25 mL has a bigger effect on a glass that’s almost full versus a glass that’s emptier, which is why our graph is not linear, but parabolic.
To confirm this new hypothesis that the shape of our wine glass produced a quadratic trend line with negative correlation, we would most likely follow the same procedure for our experiment except with wine glasses of varying shapes. For our particular wine glass, we used Google Forms to calculate the quadratic line of best fit, which is y = -0.0041x^2 + 0.2985x + 1319.7. By finding the trend lines for two new glasses with different shapes, we’d be able to better pinpoint and solidify our understanding of the nature of the relationship between resonant frequency and the height of water.
Sources of error abound in this experiment. Although we did our best to accurately measure the volume of water in the graduated cylinder to 25 mL, we most likely did not increase the water level by exactly 25 mL each time. In addition, the quality of our smartphone’s microphone probably interfered with the tuner app’s ability to determine the frequency of our wine glass. As water evaporated from our fingers, that also caused the amount of friction between our fingers and the rim of the wine glass to vary, changing the amount of vibration and frequency slightly. The pressure applied on the rim may also be different for each trial which alters the volume; this may have interfered with the tuner’s ability to accurately pick up the sound. Although we tried to keep the temperature in the room constant, the human bodies in the room and other factors may have changed the temperature slightly. The error bars in our graph were calculated by finding the difference in value between the highest and lowest trials and dividing that number by 2. The graph shows the average for each trial. As the graph illustrates, some error bars are particularly large (like the data point at 200mL), which shows that more controlled experiments are necessary to support our findings.
In order to improve the experiment, we would invest in technology to aid us in accurately increasing the water level by 25 mL each time. Also, we would buy a tuner to use for measuring the frequency rather than using an app on our smartphone in hopes that it would be more accurate. It would also be helpful if we could find a way to mechanize the way the sound is produced from the wine glass so that the pitch is produced in exactly the same way for each trial.
Bibliography.:. Go Up
Becker, Andrea. "Why Do Glass Cups Make a Ringing Noise?" Education - Seattle PI. Hearst Seattle Media, n.d. Web. 17 Nov. 2016.
French, A.P. “In Vino Veritas – A study of wineglass acoustics” Am. J. Phys., Vol.51, No. 8, Aug 1983. 17 Nov. 2016.
Giancoli, Douglas C. Physics: Principles with Applications. 6th ed. Upper Saddle River, NJ: Pearson/Prentice Hall, 2009. Print.
"Resonance." Resonance. Georgia State University, n.d. Web. 18 Nov. 2016.
Szafraniec, Anna. "History of the Glass Harp." GlassDuo. GlassDuo, n.d. Web. 18 Nov. 2016.
http://education.seattlepi.com/glass-cups-make-ringing-noise-3783.html
- This site has more good information about the physics behind singing wine
glasses.
http://www.sciencebuddies.org/science-fair-projects/project_ideas/Music_p008.shtml
- How to design and carry out your very own singing wine glass lab!
https://www.surlatable.com/category/TCA-258093/
- Beautiful selection of wine glasses at a not-so-affordable price. This site
is good for buying some high quality wine glasses for your own wine glass
experiment if you prefer top notch equipment.
https://www.youtube.com/watch?v=7hOar8dXNbA
- For fun, check out this video of a dynamic duo playing the Harry Potter Theme
with a set of wine glasses filled at different levels. Neat!
http://hyperphysics.phy-astr.gsu.edu/hbase/Sound/reson.html
- This site has more information about the resonant frequency of an object.