Table of Contents:
Introduction
Table of Contents
Background:
Water waves are caused by many different outer forces such as wind or earth movement. But would different solutions react differently to the same outer forces? Both fresh water lakes and salt water oceans are affected by the wind and earth movements, but how are we to know if the ratio of wave heights are the same? Both of these bodies of water will produce waves but they are often of different sizes because of natural differences in the weather conditions etc. John Gribbin writes that, “through the build-up of so-called greenhouse gases, such as carbon dioxide” the wave patterns in the Atlantic and Pacific oceans could change (Gribbin). In Tsunami: The Great Waves we read that Tsunamis are “a series of traveling ocean waves of extremely long length generated by disturbances associated primarily with earthquakes occurring below or near the ocean floor” (US Department of Commerce).
Table of Contents
Statement of the Problem:
The purpose of this project will be to find a relationship between mixtures of corn syrup and water, as well as the speed at which these different solutions move.
Table of Contents
Review of Literature:
According to Potma, Boeij, and Wiersma “the mobility of water molecules in cellular domains is moderately restricted due to the high intracellular content of proteins and solutes” (Femtosecond) which shows that molecules of solutions, due to the increased viscosity of the water, are harder to move. Gribbin also says that the, “great ocean currents are all interconnected” which means that each current made up of different things would bring something new to the entire system of currents. According to the US Department of Commerce Tsunami’s can also be caused by, “underwater volcanic eruptions and landslides” which would also serve to change the normal make-up of the ocean. P. Heimbach, E. Bauer and C. Staabs also believe that, “possible climate trends” could change the way that waves are formed in the ocean. Overall, most authors agree that waves are formed in drastically different ways and can be different heights, shapes, and sizes because of this.
Table of Contents
Hypothesis:
We believe that the more viscous the solution is, the slower the speed of the wave will be. This is because the molecules in the viscous solution will not be able to move as easily as the molecules of a lighter solution. The speed of a wave is defined as the distance the wave traveled divided by the time it took the wave to travel this distance.
Table of Contents
Method:
Obtain 5 quarts of corn syrup and a generous supply of water. Find a container that is approximately 77cm in length and is 14 cm wide. It also needs to be at least 10cm deep. First pour in 2 quarts of water that has been measured out. Let the water settle and then lift one end of the container (length wise) so that the bottom of the container is 20 cm off of the ground. Start the timer when the container is lowered to the floor and continue to time while the waves travel there and back twice. If the wave will not travel this far, adjust the time to the distance that the wave will travel as you will see later on. Continue this for each mixture so that there are 3 different trials. Once this has been accomplished rinse out and dry the container before continuing. The next mixture contains 1.5 quarts of water and .5 quarts of corn syrup. After this the next mixture is 1 quart of water and 1 quart of corn syrup. For both of these continue to time the wave for the previous distance. The next mixture is only timed until the wave reaches 1.5 of the length of the container. This mixture is 1.5 quarts syrup and .5 quarts water. The last mixture is 2 quarts syrup and is only timed for 1 length of the container. After recording all of the data into a neat table some calculations need to be done, including multiplying the times so that they cover the same distance in all of the trials. Each time should represent going back and forth twice. The three times for each different mixture should be averaged together so that there are five different data points. After doing this each data point should be applied to the following formula: v=s/t. S should be the length of the trough as .77 m and t being the averaged data point divided by four. After this is done all of the final velocities should be applied into some kind of graph or numerical representation.
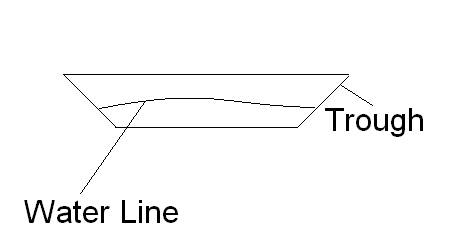

We decided to use this setup because we thought it made the most sense. The trough was ideal to measure the length and time of a wave. The shape is ideal so that the wave does not travel from side to side and continues on a fixed path each time. This insures that each experiment will be relatively the same and the data will be comparable.
Table of Contents
Results:
Data File (text) - Data
File (Excel)
Our uncertainty was rather large because the corn syrup was hard to measure exactly. Even if there was an exact amount, it was so sticky that it would not all end up in the container. We also had some trouble deciding when the wave had stopped and when the timer should be stopped. Because of that confusion our uncertainty for that area was also rather high. We decided that our uncertainty would be
Table of Contents
Discussion:
Our data points supported our original hypothesis and we felt no need to change it. As the ratio of corn syrup went up to the ratio of water the speed of the waves slowed down. We feel that this is because the corn syrup was thicker than the water and the friction slowed it down. The friction of water is generally believed to be less than the friction of corn syrup. The more the friction reacted with the plastic sidings the more the speed of the waves fell.
For further research a more accurate digital device could be used to measure the wave speed. Another avenue to continue down would include using other objects mixed with water in a similar experiment. A more detailed experiment with corn syrup could also give more answers; especially if the scientist chose to use a machine that would mix the water and syrup more thoroughly than one could do by hand. With this further research one would be able to explore even deeper into the effects of corn syrup on wave speed.
We also felt that it would help to have a larger quantity of water and syrup when it was mixed. Our total amount was never more than two quarts, in fact, it was always two quarts. If the total amount consists of 4 quarts then the wave might be able to travel a longer distance. This way one could measure the time length of the four distances in each trial. In our particular experiment we had to adjust the time length when the wave did not travel as far as the others had. If each wave could be timed for the same distance the results would be more accurate over all.
Other research might include other experiments or more trips to the library. While similar experiments would be helpful it would also be beneficial to look at past experiments that other scientists have already performed. These would lend an insight into some experiments that we may not be able to duplicate at home.
Table of Contents
Bibliography:
Femtosecond Dynamics of Intracellular Water Probed with Nonlinear Optical Kerr Effect
Microspectroscopy. Potma, Boeij, and Wiersma. June, 2001. Biophysical Society.
24 Oct 2006 < http://www.biophysj.org/cgi/content/full/80/6/3019>.
Gribbin, John. “Ocean Forces Threaten our Climate.” 2005
<http://www.firstscience.com/site/articles/gribbin.asp>.
P. Heimbach, E. Bauer and C. Staabs. “Comparison of significant wave heights derived
from the ERS-1, TOPEX, GEOSAT and SEASAT altimeters and retrieved from ERS-1 SAR Wave Mode spectra.” 1994
< http://earth.esa.int/symposia/ers97/papers/heimbach2/abstract.html>.
US Department of Commerce. “Tsunami: The Great Waves.” 1993
<http://www.nws.noaa.gov/om/brochures/tsunami.htm>.
Ocean Engineering Research Group. “Glossary of Coastal Engineering Terms.” 2006
<http://cdip.ucsd.edu/?nav=documents&sub=faq&xitem=glossary>.
Table of Contents
Other Related Pages:
How Tsunamis Work
This page has a lot of good information about tsunamis and how they are brought
about. It also has some interesting pictures involving waves.
Water
Writing With Waves: We Wonder Why
This page has some interesting new ideas about waves and what they can
do in the real world.
Underwater
and in the Air : Water Waves
This page answers some basic questions about waves and water depth.
It also talks a little bit about waves in the air as well as waves underwater.
Rogue Waves
This page describes extreme cases of wave activity around the world.
Waves
of a Sea Battle
This page describes how waves can be seen from an aerial viewpoint
during a sea battle.
Table of Contents