The Relationship Between Load and Total Energy in a 9V Battery
Will Gannett and Adam Bonica
1/14/02
Table of Contents
Hypothesis: The faster a battery is discharged, the less total energy will be obtained from that battery.
 Background
Information: Alkaline batteries are cheap, effective, safe, easy to
purchase, and easy to research, so I decided to use them for this project. Alkaline batteries, more appropriately
called alkaline manganese dioxide cells, are probably the most commonly used
battery in the world today, and certainly the most common non-rechargeable
battery. Their construction of a single
cell is actually simpler than you might think.
It consists mainly of 3 components: a zinc anode, a manganese dioxide
cathode, and a potassium hydroxide electrolyte. The zinc is 99.85% to
99.90% pure and is powdered with particles ranging from .0075 to .8 mm[1]. It uses a brass rod in the center of the
battery as a collector. The manganese
dioxide is mixed with graphite in a 5:1 ratio and its current collector is
generally the steel case of the battery.
The electrolyte is, as stated before is potassium hydroxide in aqueous
solution held in place by “carboxymethylcellulose and a non-woven fabric
separator.”[2] The equation for the reaction is as follows:
Background
Information: Alkaline batteries are cheap, effective, safe, easy to
purchase, and easy to research, so I decided to use them for this project. Alkaline batteries, more appropriately
called alkaline manganese dioxide cells, are probably the most commonly used
battery in the world today, and certainly the most common non-rechargeable
battery. Their construction of a single
cell is actually simpler than you might think.
It consists mainly of 3 components: a zinc anode, a manganese dioxide
cathode, and a potassium hydroxide electrolyte. The zinc is 99.85% to
99.90% pure and is powdered with particles ranging from .0075 to .8 mm[1]. It uses a brass rod in the center of the
battery as a collector. The manganese
dioxide is mixed with graphite in a 5:1 ratio and its current collector is
generally the steel case of the battery.
The electrolyte is, as stated before is potassium hydroxide in aqueous
solution held in place by “carboxymethylcellulose and a non-woven fabric
separator.”[2] The equation for the reaction is as follows:
2Zn(s) + 2MnO2(s) + H2O(l) ® 2MnO.OH(s) + 2ZnO(s)[3]
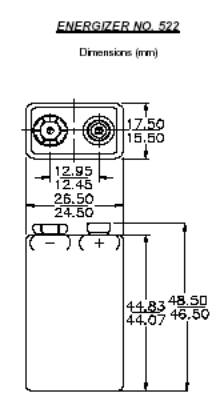
The specific construction of a 9V battery (Energizer #522) is only slightly more complicated. It consists of 6 1.5V AAAA batteries linked in series in a square case, with both terminals on one end of the battery.
<explain construction as by Kordesch> All of this and much more information is available from …
Experiment Design: My idea to test this hypothesis was to discharge batteries with different loads and see how the load affects the energy. I could use a Universal Lab Interface (ULI) to monitor the battery voltage and use different resistors to obtain different rates of discharge.
 Methods: After looking at the specifications on
Energizer’s web site, I decided to use 9V batteries, seeing as how they have a
high voltage and a low number of mAh (595, according to energizer). I then collected all the low-ohmage
resistors I could find, ranging from 10Ω to several 300Ω that had
taps every 50Ω. The plan was to
measure the voltage across a resistor connected to the battery. The voltage could then be converted to amps
or milliamps using Ohm’s Law (V=IR).
For instance, if there were 9V across a 100Ω resistor, I would
know that I=9/100 or .09A or 90mA.
Since I would then have a curve showing current over time, we could
integrate it either by curve fitting or using a rectangle-type integration. The area under the curve would then equal
the total energy output of the battery in milliamp-hours or amp-hours. By trying different resistances (and
therefore getting different currents) I would be able to get the energy output
for different initial current drains.
There were, however, several problems.
First of all, the ULI I was using to record the data only went up to 5.1
volts. This posed a problem since I was
using 9V batteries. However, I realized
that if two resistors were used instead of one, I could just measure the
voltage across one of them. This is
known as a “voltage divider”. The ratio
between the resistor I was measuring across and the total resistance would then
be the same as the ratio between the voltage we measured and the voltage across
the battery. Here is a diagram of the
setup (Fig. 1). As you can see, if the
resistors are the same value, it is possible to measure voltages of up to 10.2
volts, much more than the original 5.1.
This is obviously enough to measure a 9V battery.
Methods: After looking at the specifications on
Energizer’s web site, I decided to use 9V batteries, seeing as how they have a
high voltage and a low number of mAh (595, according to energizer). I then collected all the low-ohmage
resistors I could find, ranging from 10Ω to several 300Ω that had
taps every 50Ω. The plan was to
measure the voltage across a resistor connected to the battery. The voltage could then be converted to amps
or milliamps using Ohm’s Law (V=IR).
For instance, if there were 9V across a 100Ω resistor, I would
know that I=9/100 or .09A or 90mA.
Since I would then have a curve showing current over time, we could
integrate it either by curve fitting or using a rectangle-type integration. The area under the curve would then equal
the total energy output of the battery in milliamp-hours or amp-hours. By trying different resistances (and
therefore getting different currents) I would be able to get the energy output
for different initial current drains.
There were, however, several problems.
First of all, the ULI I was using to record the data only went up to 5.1
volts. This posed a problem since I was
using 9V batteries. However, I realized
that if two resistors were used instead of one, I could just measure the
voltage across one of them. This is
known as a “voltage divider”. The ratio
between the resistor I was measuring across and the total resistance would then
be the same as the ratio between the voltage we measured and the voltage across
the battery. Here is a diagram of the
setup (Fig. 1). As you can see, if the
resistors are the same value, it is possible to measure voltages of up to 10.2
volts, much more than the original 5.1.
This is obviously enough to measure a 9V battery.
Graph 1- In order to compare the voltages I measured, which were different due to the different resistances of the resistors, I normalized them to 9.5V (an arbitrary value) so that I was essentially comparing the percentages of the maximum voltage obtained from that particular battery. As you can see, the graphs seem to have similar characteristics at similar heights. For example, they all seem to have the lowest slope at around seven volts, and only one of them lasted for more than a minute or two after the voltage dropped below 6V. Furthermore, this clearly shows that the voltage drops off more slowly if there is a higher resistance; the 200Ω does not quickly crash as the others do. It takes it 20,000 seconds to go from 6.5V to 4.5V, a drop that the others did in a matter of seconds.
 Graph
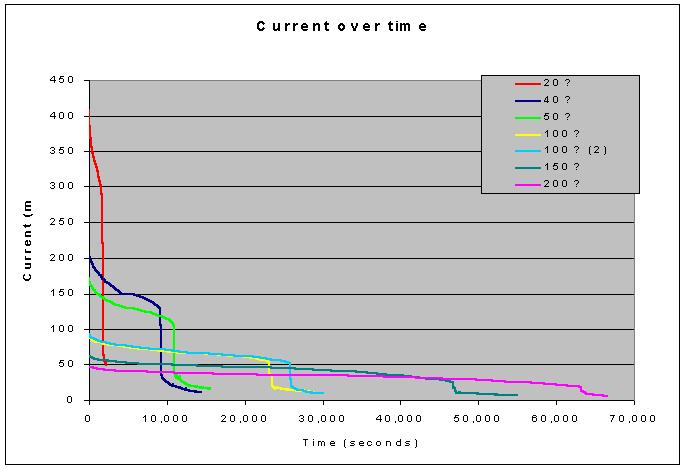
2- This graph shows the current in each circuit over time. Obviously, those batteries that discharged
faster had a higher current and therefore do not last a great amount of time. Conversely, those that have low rates of
drainage last for a rather long time (more than 15 hours). This seems intuitive, however. (If you are draining energy more rapidly from
a battery, of course it will not last as long!) With a quick visual examination, it seems that these curves have
similar areas under them (meaning that they are probably within an order of
magnitude). A closer examination,
however, is needed to determine the exact amount of energy produced by each
battery. The method I decided to use
for this is a rectangle-type integration.
I chose not to try to fit curves because I felt that there was enough
data (2000 to 6000 points for each trial) to accurately use rectangles. For each data point, I averaged it with the
previous data point and multiplied that by the difference in time between the
two. (For a clearer explanation, see
fig. 2.) The areas of all the
rectangles were then summed, giving me a pretty good idea of the area under
it. My results were as follows:
Graph
2- This graph shows the current in each circuit over time. Obviously, those batteries that discharged
faster had a higher current and therefore do not last a great amount of time. Conversely, those that have low rates of
drainage last for a rather long time (more than 15 hours). This seems intuitive, however. (If you are draining energy more rapidly from
a battery, of course it will not last as long!) With a quick visual examination, it seems that these curves have
similar areas under them (meaning that they are probably within an order of
magnitude). A closer examination,
however, is needed to determine the exact amount of energy produced by each
battery. The method I decided to use
for this is a rectangle-type integration.
I chose not to try to fit curves because I felt that there was enough
data (2000 to 6000 points for each trial) to accurately use rectangles. For each data point, I averaged it with the
previous data point and multiplied that by the difference in time between the
two. (For a clearer explanation, see
fig. 2.) The areas of all the
rectangles were then summed, giving me a pretty good idea of the area under
it. My results were as follows:
| Resistance | Total mAh |
| 20 | 170.8 |
| 40 | 397.9 |
| 100 | 442.4 |
| 200 | 581.5 |
When graphed, we get the following (shown with a curve that was fit to it):
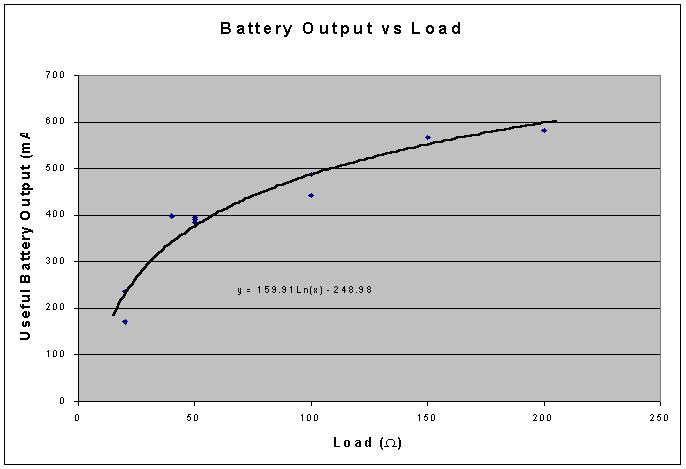
Conclusion/Discussion: As you can see, after integrating the curves, a general trend becomes apparent. The smaller the current is from a battery, the more energy will be made available from that battery. This is obviously not a linear relationship. (If you have current of 0A, there will not be an infinite of energy available.) But regardless, our hypothesis was supported by the data we collected. This data has interesting implications. When designing electronic devices that have batteries, it may be beneficial to include more than one battery, since a lessened load on each battery means that there will be more available energy per battery, and therefore less $/mAh.
The exact nature of our results, however, are unclear. Personally, I am interested in the exact nature of this phenomenon. I could not find information regarding this on Energizer’s web site. I assume that it has to do with ion diffusion through the KOH electrolyte, but again, I am not sure as to the exact nature of this. Since there are not enough data points to reliably fit a curve, my suggestion would be to perform tests on more batteries with values above, below, and in between those that have already been done. It would also be interesting to see exactly how accurate these results are by repeating several trials. If they were the same, it would imply that our data is accurate. I am also interested in seeing what would happen if instead of keeping a constant resistance across the circuit, we kept a constant current. (This is rather difficult, but I have been informed that there are I.C.s capable of doing just this)
Bibliography:
http://data.energizer.com/batteryinfo/application_manuals/cylindrical_alkaline.htm
This website, made by energizer, provides valuable graphs and equations, as well as other data, regarding the performance of alkaline batteries such as those we used.
http://data.energizer.com/datasheets/library/primary/alkaline/energizer/consumer_oem/522.pdf
This PDF is the official energizer data sheet for the 522 battery, which is the model we used in our experiment. Again, it provides extremely helpful information on the battery.