Sound reflection and its power
by Daniel Steadman
What
is Sound?
“If tree falls in the forest, and no one is there to hear it, will there be sound?” This was one of the favorite questions discussed and debated by scientists in the 18th century; its fascination lay in the fact that it could be answered, with equal validity, with a yes or a no. This is because “sound” is one of those unfortunate words that has acquired two meanings, and the answer to the 18th-century riddle depends upon whether sound is regarded as a physical phenomenon (a vibration transmitted through the air ), or as a sensation inside the mind of listener. In physical terms or in terms what it does inside our skulls, sound has power. “The power to flesh out our knowledge of the physical environment, and can add a new dimension to that provided by sight; it has the power also to stir basic emotions such as joy or terror and more complex emotions through that special form of sound called music; and, most powerful means of communication“ (Dagobert D. Runes ).
In
an air conditioning system, equipment noise transmitted down a duet is partially
reflected back toward its point of origin as it reaches the abrupt transition
from duct to open air at the grille (A. Everest). We are not surprised
when sound energy in the air is reflected when it strikes hard object,
whether it is Yodel in the Alps or the echo from the whistle blasts that the
captain of a fog-bound coastal steamer may release to gauge his distance from
the cliffs.
There are many factors, on which that power depends. Velocity, density of atmosphere and materials, used to measure the power or containing the sound itself, and of course, the frequency. The velocity of sound in the air is very small comparing to the liquids and metals, it is about 340 m/s. A sound’s frequency and its wavelength are interconnected through the speed of sound, according to the formula:
Frequency
= velocity/wavelength.
The
units of frequency are in cycles per second – that is, the number of
wavelengths that pass in one second – Hertz (Hz). Thus, than bigger frequency,
than more power the sound contains (more intensive). The units could be watts
per square meter (W/m2) or in decibels (db). Thus that sound power of
a source can be defined in terms of sound intensity (Charles E. Wilson ).
Can
we keep sound intensity (power, in different words) on long distances (because
of inverse proportion – intensity decreases when distance increases).
The
weakening of the sound, according to the law of inverse squares*, would not take
pace if the sound waves were so confined as to prevent its lateral diffusion
(John Tyndall). Also, sound reflection depends on density and surface of the
material (the angle of incidence A1 is equal to the angle of reflection A2)
I
believe that I will prevent this problem sending sound through the tube with a
smooth interior surface and the wave ,thus confined, may be transmitted to great
distances with very small diminution of intensity.
*
The intensity of the sound is inversely proportional to the square of the
distance from the point source.

This
is not so with the absorption loss in the air (a true loss), because it is of
modest magnitude at modest distances for audio frequencies. This true absorption
loss of sound pressure level increases in proportion to the distance traveled;
it is greater at higher audio frequencies.
It
was dark and rainy night….. I was alone at Physics class at 8.15 PM, where
were my plastic tube and some tools in addition, like pc speakers. J.
First of all, I found the actual sound, which I was going to measure. The
patient’s name was Chord.wav.
Hmmm. “That noisy wav from Media directory?”, you ask. “Aha”, I
would answer. My tube was on the table with a speaker at the first edge. (I
don’t care, which one, just pick it). I also used decibel meter to take data.
I
turned on the chord (wav) for a unknown amount of time (chok, chok, chok). Next,
I took examples from the both edges, so it will be possible to compare lost of
db(s) after my mysterious
experiment. L.
The tube was divided (not literally) each 0.5 meters to make 5 holes in the tube
by using drill (that’s another story J).
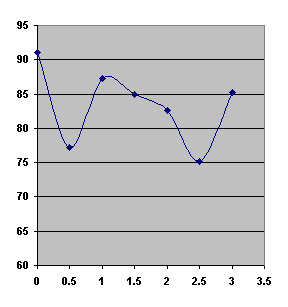
After making the hole, I took an example of sound intensity by decibel meter. At one moment I was completely surprised by the first point. Hmmm, weird. (look data). It is smaller on 13.9 db. Perhaps, this is the place, where amplitude is at lowest point (visible part of the graph). (look chart). Next points were not unexpected.

This
is an sinusoid of the lost of power by sound.
Each
time I was drilling new hole, I covered previous with the tape to make amount of
lost smaller. In 30 minutes all data was gathered. Remember, I took examples
before changing anything, so the difference between the holed tube and unholed
could not be tracked down by decibel meter. (original here)
|
distance |
db |
|
0 |
91.1 |
|
0.5 |
77.2 |
|
1 |
87.2 |
|
1.5 |
85 |
|
2 |
82.6 |
|
2.5 |
75.1 |
|
3 |
85.3 |

I’ve
expected results I had gathered, but the form of the graph is something.
Complete period looks very weird (see the graph page), though I should’ve had
more than three meters of the tube. I could see more graph area and periods.
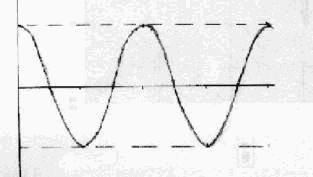
My
sound was the same each time so if there was no loss of the power, then my graph
would look almost like this function Cos (x).

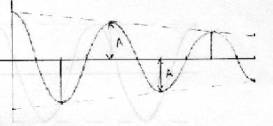
But according to the rule of the true loss I must to lose something during transportation of the sound so the data is similar to the graph #2(see on page #4).
I drew the line taking the highest points (Amplitudes) which will show the actual loss of decibels each peak.

This
graph will fall like this until zero decibels at maximum possible range for my
plastic tube. I calculated the difference between point #3 and point #8 then
divided result by 100. I’ve got percentage 2.179%/2
meters of loss each period (or 6.37%/2 m if consider distance from 0 to 3 as
whole period which is more likely is), though my calculations and measurements
were not absolutely right due to the implement and tired red eyes, though the
maximum distance would be 87.5 meters(47 meters for 6.37%)(you are still able to
hear) (pretty long ).Here are calculations:
95.71899% point #3 starts
so 95.71899% / 2.179% * 2 = 87.86 m
and for 6.37%
100% / 6.37% * 3 = 47.096 m
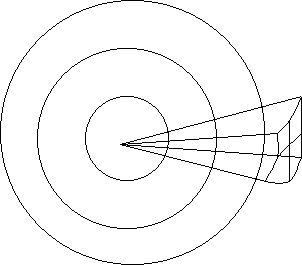
The
radius is very important too (You can still see my
pictures). I didn’t have enough materials
to find perfect radius, though, according to the loss of the intensity law, it
should be smaller for better performance, but how small? And what material has
better reflection of the sound?
1
Dagobert D. Runes
Thomas Kiernan
Book
does not have the name but still full of interesting ideas.
“The master handbook of acoustics”
This
huge book is just for people who are interested in recording stuff.
3
Charles E. Wilson
“Noise control”
concepts
of sound control
4
Malcolm J. Crocker
Frederick M. Kessler
“Noise and noise control”
Same
as above
5
Stewart C. Bushong
Benjamin R. Archer
“Diagnostic of ultrasound”
Lots
of interesting facts. Would be perfect solution for ultrasound engineers.
http://www.sasked.gov.sk.ca/docs/physics/u5c12phy.html
some information for the topic
http://sound.media.mit.edu/~dpwe/AUDITORY/jasa/v78/n2/v78n2p587.html
information on the sound
intensity
http://online.anu.edu.au/ITA/ACAT/drw/PPofM/INDEX.html
everything on sound, from
definition to THEORIES OF CONSONANCE AND DISSONANCE :)
http://230nsc1.phy-astr.gsu.edu/hbase/sound/intens.html
Sound Pressure
http://www.wylelabs.com/stsacous.htm
some sound laboratories
http://csgrad.cs.vt.edu/~chin/intensity.html
perhaps the most interesting site
of all, the actual demonstration of the sound's power!!!!!! Mac accepted.