The Effect of Stretch Distance on the Displacement of a Marble
Atlas
Jimenez-Sprague
Table of Contents | Return to Research
Introduction ………………………………………………………………………………… 2
Methods ………………………………………………………………………………… 4
Data Analysis ………………………………………………………………………………… 7
Conclusion ………………………………………………………………………………… 10
Since the dawn of time, humans have innovated increasingly advanced ways of hurling objects at each other. Catapults, cannons, BB guns: all ever evolving methods of rapidly displacing large, spherical masses to great lengths with the ultimate goal of hitting your intended target. However, one must never forget the core of this inclination; bored children wanting to see how far a marble will go depending on how hard they hit it. It’s me. I am the bored child in question. As a latchkey kid with nothing better to do after school, I would look for entertainment wherever I could that didn’t require me to interact with the other kids at my apartment complex. This led to me discovering the magic that is the marble. I found that seeing how far I could flick a marble was one of the best ways to spend the time between school and my mom getting home, despite the fact that it would hurt my finger after a while. As an ever evolving person, I am still flicking marbles but I’ve upgraded from a finger to a ruler. Hence, this experiment.
The actual physics behind this investigation is fairly simple. The first principle being the basics of energy. These sets
of equations that will be integral to this investigation will be the spring
equations. The first of which is ![]() which deals with potential energy stored in the ruler before
it hits the marble. The next is
which deals with potential energy stored in the ruler before
it hits the marble. The next is ![]() which is the equation for kinetic
energy. Using both the potential energy equation and the kinetic energy
equation will be useful in identifying the transformation of potential energy
into kinetic energy from the ruler snapping against the marble. Velocity is an
additional factor in this investigation, however due to the fact that time was
not measured and
which is the equation for kinetic
energy. Using both the potential energy equation and the kinetic energy
equation will be useful in identifying the transformation of potential energy
into kinetic energy from the ruler snapping against the marble. Velocity is an
additional factor in this investigation, however due to the fact that time was
not measured and ![]() , the velocity equation is not
applicable to the investigation. However, since displacement is proportional to
velocity, those bases are covered.
, the velocity equation is not
applicable to the investigation. However, since displacement is proportional to
velocity, those bases are covered.
The purpose of this investigation is to find the relationship between the distance a ruler is pulled back, and the distance the marble travels before hitting the ground
Variables
Independent variable: In this experiment, the independent variable will be the distance the ruler is pulled back and thus the hit velocity on the marble. The stretch distances will be in single centimeter increments from 2 cm to 8 cm. This will be measured in velocity, which will be calculated using the time it takes for the ruler to hit the marble and the displacement in centimeters from the marble.
Dependent variable: My dependent variable in this experiment will be the distance the marble will travel following each hit. This will be measured in centimeters.
Control variable: The control variables will be the number of trials and the weight of the marble. Each different velocity will be measured with five trials each. [control = marble weight]
Hypothesis
If a marble is hit with a greater kinetic energy from rest, then the distance the marble will travel will be greater because the force hitting the marble increasing will increase the distance traveled. This is because due to the elastic potential energy becoming the kinetic energy, they are directly proportional to each other and therefore cause a steady, linear increase in the total distance traveled by the marble.
Materials
- Marble: 3.9 grams
- Meter stick: Used to hit the marble.
- Ruler: Used to pull back the meter stick.
- Transparent ruler: Used to measure the stretch distance of the meter stick and hold the marble in place.
- Measuring tape: up to 4 meters, used to measure the displacement of the marble.
- Table: a random table in the back of my teacher’s room off which the marble would be sent.
- Second table: Used to block the marble from leaving the testing space.
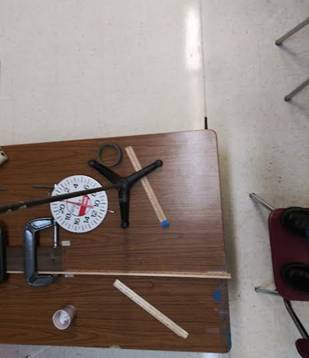
Photo of set up
Procedure
Before beginning the experiment, the set up needed to be constructed first. The transparent ruler was taped onto the table with a hole drilled in the end so that the marble would remain stable during the experiment. The meter stick was securely attached by a metal clamp to a block screwed into the table. The third ruler would pull the meter stick back in order to hit the marble at the correct stretch distance.
A stretch distance of 1 cm was unable to fully exit the table and therefore unable to provide conclusive results. This means that the experiment would successfully begin at 2 cm stretch distance. For each stretch distance, there would be five trials and seven different stretch distances would be tested, coming to 35 trials total. For each trial, the independent variable would be manipulated by pulling back the meter stick to the desired stretch distance in order to set the trial into motion. The dependent variable was measured by eye in centimeters using a long roll of measuring tape. The marble would be launched and the spot where it first hit the ground would be the distance for that trial.
The fact that this experiment hinged on hitting a marble at varying speeds, obviously there were a couple of concerns to be taken into account. The first of which was my own and my teacher’s safety. There was a good chance that if one of us were to be struck by the marble mid-trial, that our peers would have to put up with us complaining about a minor injury we sustained at 7:30 in the morning. In truth, there was no real pertinent danger posed to myself or others. That being said, the area that was being used for the experiment was quartered off anyway. Additionally, loss of property was another big concern in this investigation. Ideally, I would have used the same marble for every trial to ensure that its weight didn’t affect my data. Luckily, the marbles were all from the same pack, making the weight disparity essentially negligible, but still worthy of considering. After the first day of data collection, I noticed that I was having to run after my marble after almost every trial and even lost two marbles (which prompted my teacher to inform me that I was in fact losing my marbles). In order to remedy this, I set up a blockade at the end of the experiment space to ensure that no more marbles would be lost.
Raw data
Distance Data
|
Stretch Difference |
Displacement |
|||||
|
+/- 0.05 cm |
S / m |
|||||
|
x/cm |
Trial 1 |
Trial 2 |
Trial 3 |
Trial 4 |
Trial 5 |
|
|
2.00 |
0.49 |
0.57 |
0.53 |
0.53 |
0.52 |
|
|
3.00 |
0.60 |
0.58 |
0.75 |
0.78 |
0.80 |
|
|
4.00 |
0.80 |
0.97 |
0.83 |
0.89 |
0.96 |
|
|
5.00 |
1.19 |
1.28 |
1.22 |
1.29 |
1.23 |
|
|
6.00 |
1.64 |
1.77 |
1.72 |
1.62 |
1.52 |
|
|
7.00 |
1.39 |
1.79 |
1.82 |
1.82 |
1.88 |
|
|
8.00 |
2.95 |
2.78 |
2.93 |
2.93 |
2.90 |
|
The Distance Data table displays the raw data of the experiment. The data is separated
into trials and stretch distances. To be able to graph this information, the
data from each trial needed to be averaged in order to get an easily graphable set. To do this, the data would need to be
averaged using the Average formula, ![]() .
.
Example (SD: 3 cm)
![]()
Additionally,
due to the averaging of the data set, there was a need to consider the
uncertainty of said data. This was done with the Uncertainty formula, ![]() .
.
Example (SD: 3 cm)
![]()
Graph of Processed Data
This graph shows the averaged displacement of the marble at the differing stretch distances. As can be clearly seen above, the averaged data is overall linear. The graph also includes error bars on each point, which came from the uncertainties calculated previously.
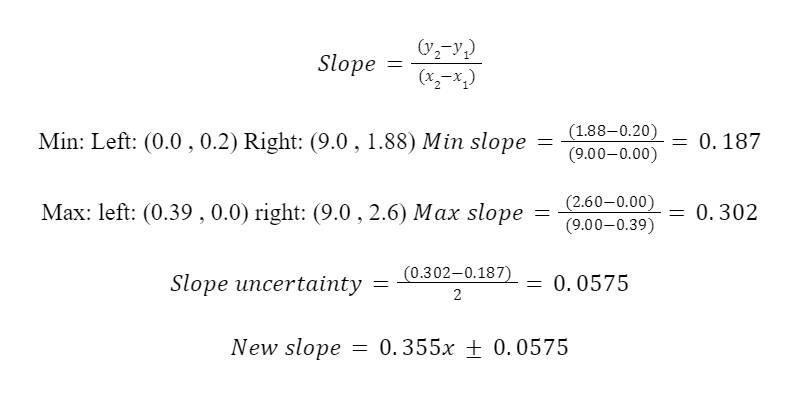
Graph of Min and Max Slopes
The graph above shows the minimum and maximum slopes within the error bars of the set. These will be able to show the uncertainty of the trendline within the data set. One thing to note is that the final data point is not included in the range of the min and max lines. This is because the final data point was an outlier, but this will be further explained later on. Nevertheless, the slopes of the minimum and maximum slopes are calculated in order to find the uncertainty of the trendline.
Throughout this experiment, the hypothesis made at the beginning of this investigation has been supported by the results. The data was linearized in the same manner as predicted; the distance displaced gradually increased proportionally with the change in stretch distance. This is due to the relationship between the change from elastic potential energy to kinetic energy and acceleration at rest. In terms of this experiment, the change in energy from the meter stick transferring to the marble greatly influenced how far the marble would go depending on the distance the meter stick was stretched before launch. This is reflected in the data that was collected and graphed.
Unfortunately, there were many sources of potential error within the experiment.
The first of which being the setup itself. As can be seen on the image in the
Methods section, the marble was struck from the center of the table instead of
from the edge. This caused the marble to travel more than was actually
recorded, thus leading to possible inaccuracies in the data. Additionally,
another possible source of error arose from how the data was gathered. As this
experiment didn’t have the benefit of a top down camera to more accurately
measure the distance displaced by the marble in each of the trials, the
displacement data was subject to human error. Finally, the amount of trials
and/or variations could have been increased in order to avoid errors in the
data collection from a lack of information. Including one or all of these
changes to future experiments could provide clearer, more accurate data and
shed more light on the connection between elastic potential energy and kinetic
energy and distance displaced.
https://www.khanacademy.org/science/hs-physics/x215e29cb31244fa1:modeling-energy/x215e29cb31244fa1:calculating-energy/a/spring-force-and-energy-ap1
--
Very succinctly explains what spring potential is and shows what many of the
equations are and how to use them.
https://en.wikipedia.org/wiki/Elastic_energy
-- It’s the Wikipedia. All the knowledge of the universe pertaining to elastic
energy is held here. It’s helpful.
http://spiff.rit.edu/classes/phys311.old/lectures/disvel/disvel.html
-
:~:text=Displacement%20is%20the%20vector%20difference,which%20displacement%20changes%20with%20time.
-- It talks a lot about the relationship between velocity and displacement.
Also looks pretty cool.
https://www.britannica.com/science/Hookes-law
-- Talks about the history of and the discovery of elastic potential energy.
Hooke’s law specifically.
https://thescienceandmathszone.com/suvat-equations/
--
Though SUVAT equations were not used in the final analysis of this experiment,
they are integral to many aspects of displacement questions. VERY important to
know.