The Relationship Between the Change in Pressure and the Launch Velocity of an Air Cannon :
Background | Problem | Method | Results | Conclusion | Links | Bibliography | Return to Research
Background: Top
The use of an air cannon can be traced back to Britain during world war II. “ …sailors on commercial freighter ships were left vulnerable after their anti-aircraft weapons had been rerouted to warships. Desperate to protect themselves from enemy attack, the sailors adopted a weapon developed by the Department of Miscellaneous Weapons Development. Dubbed a Holman Projector, it could shoot projectiles out of a tube using steam from the ship’s boiler” (rossen). Eventually people still felt the desire to use the air cannon, but rather with the use of carbon dioxide than steam boilers. Smaller, less lethal projectiles were used rather than explosives like potatoes, paintballs, or even t-shirts. Tim Derk, the mascot for the San Antonio Spurs from 1983 to 2004 was one of the first people to revolutionize the use of an air cannon to give out gifts such as t-shirts, hats, and other apparel. The mascots were limited to the distance of their throwing arm. Shortly after Derk used his cannon, several other mascots would copy the technique and eventually mascots across the NBA, NFL, NHL, and MLB would use these monstrous machines to spread merchandise to their fanbases. The cannon would change in weight from an obnoxious 90 pounds to a convenient 2 pounds. I belive an air cannon can function because of the ideal gas law, which states that with any ideal gas, variables such as; pressure, volume, moles, and temperature are relative to each other. Using the formula
PV = NRT, where R is a gas constant, and Volume and Temperature remains constant, the two remaining variables relating to the air cannons, velocity and pressure are found connected. As pressure is added to the cannon, the flowing gas will push onto the projectile, and will demonstrate the equation F=PA.
Statement of the Problem: Top
The purpose of this investigation is to find out the relationship between the change in pressure applied, and the launch velocity of the air cannon. The dependent variable is the velocity of the object fired from the air cannon, and the independent variable is the pressure applied to the air cannon. Controlled variables consist of the ball weight and size, area for pressure, and cannon size. Pressure is defined as continuous physical force exerted on or against an object by something in contact with it, and velocity is defined as a vector quantity that refers to the rate at which an object changes its position.
Hypothesis:
I believe that the launch velocity of the air cannon will increase as the pressure applied increases, because assuming the area of the cannon remains the same, mathematically pressure should decrease and velocity decreases and vice versa.
Materials:
In this experiment I used a variety of tools and resources to gather data. To start I used an air cannon with extensions that attached to a voltmeter and a gauge pump. The object that I launched were miniature tennis balls that could fit in the frontal tube of the air cannon. I used multiple pieces of wood to keep the air cannon vertically flat, and photogates to measure distance and time between them. I had a cardboard box with a towel to act as a cushion for the ball. I used a basic computer with a program that the photo gates connected to, in order to record velocity. The independent variable for this experiment will be the pressure, and the dependent variable will be the velocity of the projectile.
Diagram:
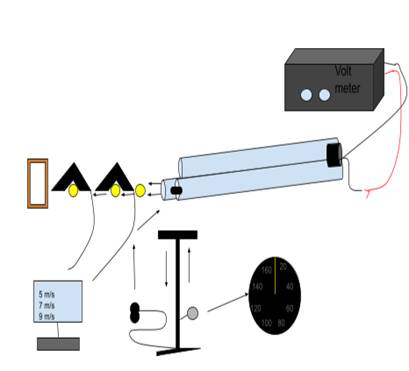
Procedure: Top
For data collection I chose to collect 10 unique data points for three different trials, gathering a total of 30 points. I would have gathered more data per trial, but above a certain amount of pressure, data would be less efficient and more effort consuming. I gathered points in patterns of 5, starting from 20 to 65. For the lab I would start by putting one of the miniature tennis balls in the air cannon and make sure the photo gates were lined up and ready to collect data. I would then set up the computer program to make sure all I had to do was click “collect” and start. I would then proceed to pump the appropriate amount of pressure via the pump and add the pressure to the cannon using an extension on the pump. Once the pressure was added, I would quickly run the program on the computer, and attach the wire on the end of the voltmeter to the wire on the end of the cannon. The ball would ideally launch through the photo gates and record on the computer for me to record. Throughout the experiment I would try to keep the position of the cannon along with the photo gates unchanged. The Voltage on the voltmeter was also constant. Essentially only the amount of pressure applied and the velocity would be independent and dependent variables. The cannon would not shoot at a velocity that was considered dangerous, and it would be launched into a cushioned box. So there were relatively no safety concerns, as long as one didn't injure themselves in collecting data in the form of countless pumping motions.
Results: Top
Raw Data:
|
Gauge pressure |
Launch Velocity |
|
|
|||
|
+/- .5 |
Velocities in m/s |
N |
N |
|||
|
x / psi |
Trial 1 |
Trial 2 |
Trial 3 |
Averages |
Uncertainty |
|
|
40 |
5.952 |
5.773 |
5.743 |
5.823 |
0.105 |
|
|
45 |
6.994 |
6.131 |
6.775 |
6.633 |
0.432 |
|
|
50 |
7.672 |
7.420 |
7.508 |
7.533 |
0.126 |
|
|
55 |
8.065 |
8.095 |
8.445 |
8.202 |
0.190 |
|
|
60 |
8.341 |
9.085 |
8.894 |
8.773 |
0.372 |
|
|
65 |
9.546 |
9.713 |
9.007 |
9.422 |
0.353 |
|
|
70 |
10.220 |
10.229 |
10.404 |
10.284 |
0.092 |
|
|
75 |
11.896 |
11.303 |
11.367 |
11.522 |
0.297 |
|
|
80 |
12.082 |
12.176 |
12.083 |
12.114 |
0.047 |
|
|
85 |
13.822 |
13.224 |
13.323 |
13.456 |
0.299 |
|
Data processing:
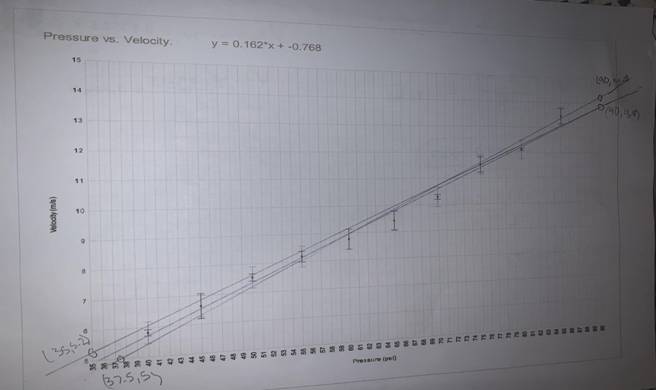
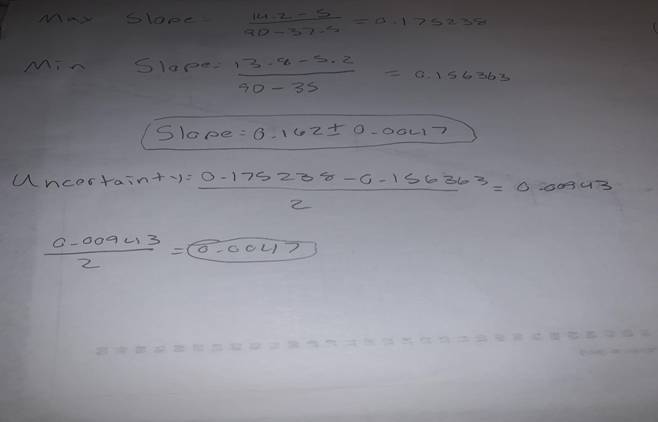
When looking at the data I gathered, I can see a correlation between the increase in pressure in psi and an increase in velocity. This linear relationship suggests or proves my hypothesis to be correct, that there is a relationship between pressure and velocity. Using the pressures and the averages I calculated in the table, I can graph my raw data into processed data and determine how linear the relationship I recorded is.
Processed data presentation:
Conclusion: Top
After thorough experimentation I concluded that there is a direct relationship between pressure and launch velocity when using a projectile and an air cannon. I theorize that the relationship is similar to that of capacitance. The formula for capacitance states one half the capacitance times the voltage squared equals the capacitor energy. Similarly the capacitance can be represented by the volume of the cannon, and the voltage by the pressure. This relationship also compares to the formula for potential energy (Ep=1/2.k.x²). All of this suggests the relationship between constants, pressure, and velocity. There are limitations to this experiment and much room for human error to look out for. During the process of attaining unique pressure quantities I was required to eye the gauge and get as close as I could to the right pressures.I also ran into simple mistakes such as; forgetting to click the start button on the computer program, or not setting up the tennis ball from the last collection. A large quantity of trials including errors, that make you restart, can be tiring and may cause fatigue. Near the end of my data collection I would experience a harder time getting to the pressures I needed, and may have experienced errors because of it. The data will probably never come out perfectly linear, but a large variation of data points and different trials over a long period of collection can help better this experiment. Or maybe keep the pressure at a low constant to make it easier, and change the projectile mass or type.
Bibliography and Related Websites Top
https://www.physicsclassroom.com/class/1DKin/Lesson-1/Speed-and-Velocity - article on basic speed and velocity collection and calculation
https://www.physicsforums.com/threads/help-with-air-pressure-volume-in-an-air-cannon.447506/ - a discussion on the relationship between volume and pressure and velocity
https://www.mentalfloss.com/article/611975/t-shirt-cannon-history - background on the technology behind and air cannon
https://www.westfield.ma.edu/PersonalPages/cmasi/gen_chem1/Gases/ideal%20gas%20law/pvnrt.htm explanation of ideal gas law and PV = NRT
https://www.physicstutorials.org/home/energy-work-power/kinetic-energy/35-potential-energy?start=1 - website explaining the formula for potential energy
http://persweb.wabash.edu/facstaff/madsenm/publications/AJP_80_24_rohrbach_air_cannon.pdf - another example of a similar experiment