How Different Concentrations of Salt Affect the Boiling Point of Water
Background Information:
The boiling point of a liquid is the temperature at which its vapor pressure equals the pressure of the gas above it. One factor that affects the boiling point is the type of molecules that make up the liquid. That is why water, for example, has a different boiling point (100°C) from ethanol (78.4°C). The formula to find boiling point is ΔT = i Kb m. The van’t Hoff factor, or i, is a constant associated with the solute. This experiment will be using salt as the solute, and the van’t Hoff factor of NaCl is 2. Kb is the ebullioscopic constant. Water will be acting as the solvent in this research, and the Kb for water is 0.52 °C/m. M is the molality of a solvent, which is moles solute/kg solvent. According to this equation, different concentrations of salt water will have different boiling points, because the molality will be changing, ultimately affecting the ΔT.
Statement of the Problem:
The purpose of this investigation is to determine the different boiling points at several different concentrations of a NaCl solvent in a fresh water solute.
Hypothesis:
I believe that the greater the concentration of salt within water, the higher the change in temperature will be. The more mass of solvent, the greater the molality will be. Therefore, this will ultimately result in a higher temperature. The independent variable in this experiment is the mass of salt (concentration), and the dependent is the change in temperature in the overall boiling point of water.
Materials .:. Go Up
-Bunsen burner
-Thermometer that can connect to LoggerPro
-1000 mL (1 L) beaker
-Kosher salt
-Electric balance beam
-Saucer/container for salt
|
|
Procedure .:. Go Up
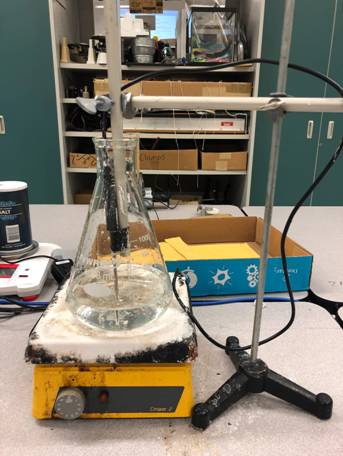
First, the beaker is filled to 400 mL with sink water and placed on top of the bunsen burner. The burner is then turned on, and the water is brought to a boil. A thermometer must be placed inside of the beaker, so that the computer program LoggerPro may track and graph the changes in the temperature of the water. Measure out 16 grams of salt on an electric balance beam, zeroing out the mass of the container. When the plain, salt-free water reaches its boiling point, cautiously add in the salt. Observe the change in temperature as it rises to a new boiling point. If the water level has gone below 400 mL, pour a little bit more into the beaker until it is at 400 mL again. Repeat this 10 times, pouring in another 16 g of salt with each variation, so that by the end, there is a total of 160 g of salt in the water, (about 40% saturated, close to the highest solubility of salt in water). Find the average boiling point temperature by looking at the plateau on the LoggerPro graph, as the plateau indicates the highest boiling temperature for that particular liquid. Record those boiling point for each increment of salt added in (16, 32, 48, 64, 80, 96 112, 128, 144, 160 g).
Data .:. Go Up
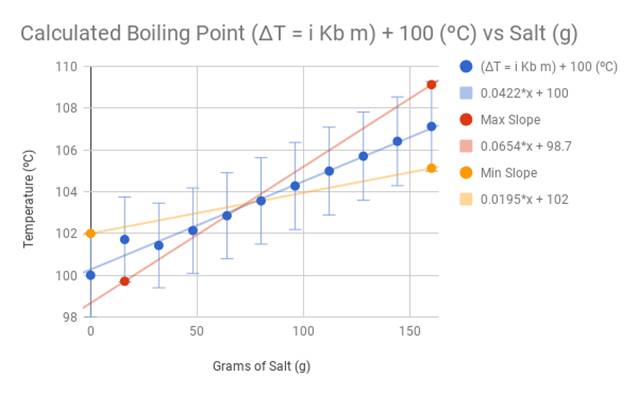
I performed three test trials and took the average of the results. Below is the data table and graph. I also calculated the ideal boiling point using the equation ΔT = i Kb m. The constants of this particular equation in relation to salt as a solute and water as a solvent manipulated the calculations to be 1.04((x/58.4)/0.4), with the x being the amount of salt (g) being added into the solvent. I also added 100 ºC (the established boiling point of water) to the resulting change in temperature (ΔT). I compared the results to my personal data, and recorded the difference in temperature.
Table:
|
Salt (g) |
Observed Boiling Point (ºC) |
Calculated Boiling Point using ((ΔT = i Kb m) + 100) (ºC) |
Difference in Temperatures (ºC) |
|
0 |
101.2667 |
100 |
1.2667 |
|
16 |
102.4333 |
101.7123 |
1.7210 |
|
32 |
103.0333 |
101.4247 |
1.6086 |
|
48 |
103.7667 |
102.1370 |
1.6297 |
|
64 |
105.1 |
102.8493 |
2.2507 |
|
80 |
106.3333 |
103.5616 |
2.7717 |
|
96 |
107.5667 |
104.2740 |
3.2927 |
|
112 |
109.562 |
104.9863 |
4.5757 |
|
128 |
108.4667 |
105.6986 |
2.7681 |
|
144 |
109.2333 |
106.4110 |
2.8223 |
|
160 |
109.5 |
107.1233 |
2.3767 |
Graphs: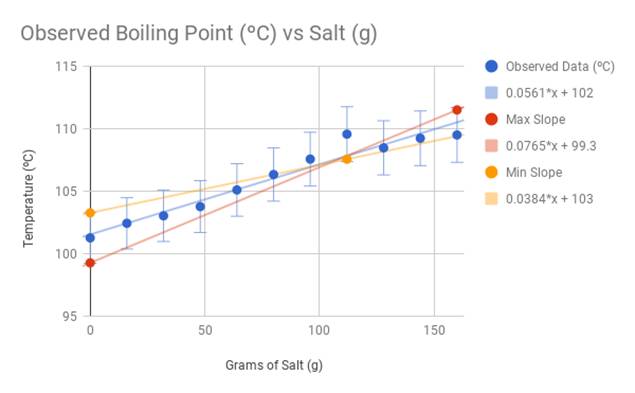
Conclusion .:. Go Up
Analysis:
The observed data from my experiment differs slightly from the calculations of the official boiling point equation ΔT = i Kb m. The trendline for the observed temperatures is 0.0561x+102. The trendline for the calculated temperatures is 0.0422x+100. Because the coefficient 0.0561 (from the observed temperature trend line) is larger than 0.0422 (calculated temperature trend line), this indicates that during the experiment, the water heated up faster and at a steeper rate than expected compared to the theoretical data. However, the overall data confirms my hypothesis that the higher the concentration of salt in water, the higher the boiling point will be.
Errors:
One of the obvious errors in this experiment is human error. There were instances during my trials where some of the salt could have escaped as I poured it into the beaker. Therefore, the salt added in might not have been exactly 16 g each time. Also, I observed the change in temperature through LoggerPro. The boiling point can be located on a graph by looking at where it plateaus. Though the program calculated the mean temperature of a certain section, I had to personally select an area where I estimated the plateau to be. Therefore, I could have misjudged the true location. Another source of error is the evaporation of the boiling water. Though I attempted to maintain the water level in the beaker at 400 mL, there is the possibility that as I added in salt, the mass of the water increased, making the ratio of salt to water no longer proportional or at the desired saturation.
Future Improvements:
In a future replication of this experiment, there are some improvements to be made that would produce more accurate results. First of all, the loss of water through evaporation must be accounted for. A method of doing this would be to take the mass of the water every time salt is added in, to make sure the water is still at 400mL, apart from the mass of the added salt. Also, a more quality funnel should be used to ensure that all of the salt lands in the water. Finally, if possible, a more accurate way of observing the boiling point should be used besides the human eye and LoggerPro, such as a program specifically designed to indicate the highest boiling point of a solute.
Bibliography .:. Go Up
-https://www.chemteam.info/Solutions/BP-elevation.html
This website was helpful as it provided the equation required to solve for the boiling points of different solutes.
-https://www.cliffsnotes.com/study-guides/chemistry/chemistry/solutions/freezing-and-boiling-points
This was helpful as it contained many examples of how to solve for boiling points.
-https://www.chem.purdue.edu/gchelp/liquids/boil.html
This site was helpful because it had background information about what boiling point is.
https://chemistry.stackexchange.com/questions/69038/solubility-of-nacl-in-water
This website contained relevant questions and answers about the nature of boiling point and how to find it.
https://study.com/academy/lesson/calculating-boiling-point-elevation-of-a-solution.html
This site provided many visual examples and aids.