Physics Internal Assessment:
What effect does drill bit size have on the volumetric flow rate measured by half-life?
Names: Kaitlyn Haudbine, Jordan Maddox, and Denali Webber
Introduction - Question – Method – Results – Conclusion – Appendix – Related Websites - Bibliography – Return to Research
Background
When you were a kid playing outside with a hose to create your own mini-waterpark on a hot summer day, did you ever put your thumb over part of the opening of the nozzle, and all of a sudden it seemed like the hose became possessed and started to shoot water out way faster? If so, you have been investigating physics since you were a little kid! This idea is called volumetric flow rate, and water is a free flowing matter that has volumetric flow rate (VFR). In physics, the VFR is the volume of fluid which passes per unit time. There are many variables that affect volumetric flow rate such as the hose example, in that case you were decreasing the area in which the water could flow out of the hose, and in turn this increases the velocity at which the water comes out, as demonstrated by the continuity equation:
As demonstrated by the diagram, as the area gets smaller the velocity increases. This essentially means that even though the area in which water is flowing is smaller, since the water's’ velocity is increased it will end up with the same flow rate as the bigger opening. It is also important to note that this equation is only true for flat, plane cross-sections (Continuity Equation).
Additionally the height of the water has an effect on the VFR too, for example, when water is placed in a bucket and at the bottom of the bucket there is a hole, the water that comes out will have a rated speed depending on the height of the water (Putra). The Bernoulli’s equation is used in order to calculate factors concerning height, pressure, velocity, etc, but this theory ignores real world factors such as internal and external friction, and turbulence so it is best suited in theory, and not in a real situation. In order to take into account heights role on the VFR the openings at the bottom of our bucket are all the same height from the bottom of the bucket. VFR is also affected by viscosity, and this is known as Poiseuille's Law:

And while obviously changing viscosity will change the flow rate, with this equation changing the radius versus any of the other variables has the most significant effect on the VFR! According to Hyperphysics, just a 19% increase in radius will double the VFR (Poiseuille's Law).
Additionally, the equation of flow rate can be represented as the following:
The equation above states that the discharge/volume flow rate is equal to the volume divided by the time. This proves that volume flow rate does change since the time it takes for water to flow out of a container will increase or decrease depending on the size of the opening. The VFR is affected by both the radius and time (half-life), so since the radius is the independent variable and will be manipulated, it will affect both the time and, in turn, the VFR. The significance of understanding how flow rate works, and the different variables that go into altering it, is very important for our world because flow rate is a key part of many existing fields. For instance, flow rate is used in medicine for further understanding how the human body works and how certain treatments and diagnoses are made. Overall, we are excited to investigate first hand into the world of volumetric flow rate.
What effect does drill bit size have on the volumetric flow rate of water flowing from a bucket measured by half-life?
Variables-
Independent: Size of the drill bit (hole)
Dependent: Flow rate (and half-life)
Controlled (but not limited to): Bucket, initial and final amount of water in bucket, timer (person), bucket is placed on same surface (180° flat surface-measured), temperature of water (72° F), room environment, and person filling the bucket/ measuring the 8L mark
Hypothesis-
We believe that increasing the size of the hole in the bucket will increase the volumetric flow rate due to the flow rate equation. The equation shows that the relationship between volume and time has a significant effect - an increase in time will therefore increase the VFR. However, we also believe that half-life will decrease as we increase the opening size because half-life is directly linked with the time it takes to let half of the water flow out.
Preliminary Work
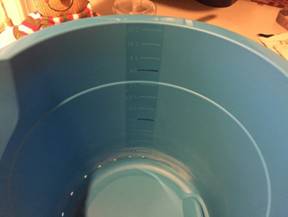
Bucket Selection: We found various types of buckets at the store which could be used for our data collection. After evaluating the size and details of each, we decided to select a bucket that was a good size in terms of collecting half-life data and that made data collection easier and more accurate. We chose to use a medium-sized bucket that had measurements labeled within it.
Size of the holes: After drilling holes with different sized radii, we will evaluate how the flow rate varies between the holes. Our lowest measured hole will be 11/64 of an inch because with anything smaller, we were unable to drill a hole that was completely clean, and the amount of time it would take to drain 4 L of water would get to lengthy. Additionally, in order to make sure height would not affect the VFR we drilled the holes all out the same height on the bucket
Half-life: This will be calculated based on the time interval between two measurements of the amount of water (the starting amount and half of the original amount) in the bucket using the half life equation

Half-life will be the most accurate form of measuring flow rate because it will give the most precise results. If we allowed all of the water to drain from the bucket, there could be major sources of error because water could accumulate and get stuck in the bottom of the bucket, so we would be calculating different amounts of water leaving the bucket and, therefore, our data and calculations would be erroneous. Additionally, to calculate velocity would be more strenuous and complicated since we wouldn’t have technology that could more accurately measure that.
Time Measurement: The amount of water that escapes from the bucket will be measured using the measurements labeled within the bucket (marked darker than the rest in order to more accurately see it). We will use a stopwatch to time how long it takes for the water to escape from each hole in the bucket, stopping the timer when the water is at half of its original amount (half-life). Reaction time of the stopwatcher was taken into consideration, but is fairly negligible and couldn’t be improved without use of technology.
Materials-
10 L bucket, duct tape, stopwatch, 10 different drill bit sizes, sandpaper, a water source, oven rack (in order to see under the bucket to make sure it isn’t leaking), a level, any items needed to stable rack and bucket (we used towels), a cup (to finish filling the bucket when it is close to the 8 L mark), notebook to record data, and dark colored marker.
Diagram-
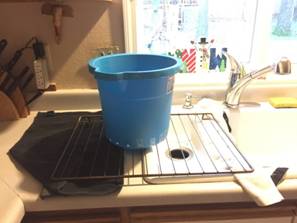
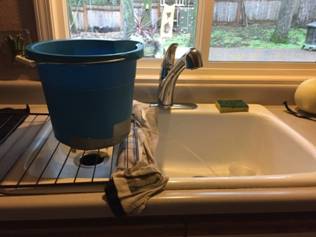
Procedure
First, acquire all needed materials (including building your table in your notebook), after that drill 10 different sized holes, all at the same height in the bucket. Sandpaper the inside of the just to make sure they are not rigid and that all the little pieces of the bucket have been removed from the opening (so they don’t mess with the flow of the water). Next, mark the 4L and 8L mark inside the bucket with a dark colored marker, and start to duct tape all of the holes on the inside and outside except the one that you will first time. Fill the bucket up to about the 8 L mark and check under the bucket to make sure your tape is holding and that there is no leakage, if there is no leaking measure as accurately as possible to the 8L mark using a cup if you need a more accurate source of water. If there is leakage, add more duct tape to the holes until there is no more (you may need to empty the bucket and dry it for the most accurate results). Once the timer is ready, another person will rip off the piece of tape on the front side of the bucket covering your first opening, and the timer will start the stopwatch. Then after the bucket has emptied to the 4L mark and the timer has stopped the stopwatch and is recording the information, the other person can place another piece of tape over the same hole and start to fill up the bucket because you will do three trials for every hole and take the average. After the three trials, dry the bucket near the bottom and empty any remaining water out. Then tape the inside and outside of the hole you just timed, and then remove the inside piece of tape for the next opening you want to time. Next, you will fill up the bucket back up to the 8L mark and repeat the steps until you have timed three trials of each of the ten holes. Using the information you have gathered calculate half-life and VFR and graph it.
Processed Data Tables
The data table has the half-life and predicted and experimental flow rate of the different size drill bits:
Example Calculation (for half-life):

Example Calculation #2 (for predicted flow rate):
Example Calculation #3 (for experimental flow rate):
Table of Drill Bit Size to Half-Life, Predicted Flow Rate, and Experimental Flow Rate:
|
Drill Bit Size (in.)(+/- .002) |
1/2 |
3/8 |
5/16 |
17/64 |
1/4 |
15/64 |
7/32 |
13/64 |
3/16 |
11/64 |
|
Half-Life (s) |
29.627 |
54.577 |
73.733 |
106.413 |
124.073 |
138.430 |
162.497 |
184.273 |
212.670 |
252.763 |
|
Predicted Flow Rate (m3/s) |
2.36066E-04 |
1.32787E-04 |
9.22133E-05 |
6.66241E-05 |
5.90165E-05 |
5.187E-05 |
4.51845E-05 |
3.89601E-05 |
3.31698E-05 |
2.78945E-5 |
|
Experimental Flow Rate (m3/s) |
1.73828E-4 |
9.43621E-5 |
6.98425E-5 |
4.839619E-5 |
4.15077E-5 |
3.7203E-5 |
3.16930E-5 |
2.79476E-5 |
2.4216E-5 |
2.03748E-5 |
Chart 1 are the plotted points of the processed data from the first row of the data table visually showing that the half-life of different opening sizes decreases as the area of the holes increases.
Chart 2 are the plotted points of the processed data from the second row of the data table visually showing that the calculated flow rates of different opening sizes increases as the area of the holes increase.
Chart 3 are the plotted points of the processed data from the third row of the data table visually showing that the experimental flow rates of different opening sizes increases as the area of the holes increase.
Uncertainty- We had the same person timing the emptying bucket every time, and she took a reaction time test and her averaging reaction time score was .339 seconds, so that is including as an experimental uncertainty. Additionally, there is uncertainty with the measurements of the size of opening (+/- .002) and the stop watch only went to two decimals (+/- .005 ).
The goal of this lab was to determine if volumetric flow rate changes if the radius of the hole is altered. We believed that increasing the size of the hole in the bucket would increase the volumetric flow rate due to Poiseuille’s Law, which shows that increasing the size of the radius drastically increases the VFR and vice versa, and the flow rate equation stating that volume/time. This equation shows that flow rate will change if time changes (which it would due to the alteration of the radii). We also predicted that half-life would decrease as we increased the opening size because half-life is directly linked with the time it takes to let half of the water flow out. Our data shows that the half-life decreased as the drill bit size increased since a larger opening allows more area for the water to flow through, which led to quicker times. Next, we calculated what our potential flow rate would be based on our radius, and we found that as the radius of the opening increased, the flow rate increased. Luckily, the same was true for our experimental flow rate that we calculate using the Q=v/t equation. We believe this occurs because as the water has more space in the opening to flow out, naturally the flow rate increases. Additionally, one can see from the graphs that the first seven data points are fairly grouped together; whereas, the last three are more spread apart and appear to be outliers. However, the reasoning for this is that in the drill bit size container the smallest sizes are evenly spaced and as the sizes get bigger (points 8-10) the become no longer evenly spaced. This is also why we put trendlines in our graph because they demonstrate what the flow rate would be if we had evenly spaced drill bit sizes. Also one may note the “r” values displayed on the graph, this represents the accuracy of our trendline in relation to the data. The closer “r” is to 1 means the more accurate the trendline is, and from our “r” values one can see that in all of our graphs the trend lines were very accurate. Overall, our hypothesis was correct in predicting the behavior of the flow rate and half life.
The following points are the errors of our experiment but they are not limited to the following. When filling the bucket up with water, we measured as closely as we could to the 8L mark and used a cup to increase accuracy, but it is nearly impossible for the human hand to mark exactly 8L of water (and stop it when it hits the 4L mark). To improve this in future investigations one would most likely have to use a machine to measure out the water accurately, or increase the amount of water being used because if we were to conduct this experiment with 10,000 gallons of water being off by a few ounces wouldn’t affect the outcome of half-life. However, all things considered not having the preciseness of the 8L is fairly negligible. Next, our investigation consisted of the uncertainty of a human timer, while we did use the same person every time, and calculated the uncertainty of that person’s reaction time, it is still a potential limitation. In order to correct this, it would most likely be beneficial to have a device that could sense when the water passed the 8L and 4L mark and timed it accordingly. In part with the reaction time, another potential limitation would be the time it takes for water to flow from the bucket to start after the duct tape is removed and the stopwatch starts. While this is just milliseconds, the duct tape blocks the flow in the beginning, and in order to correct this we, in the future, could use more manpower and have one person plug the opening with their finger while another fills up the bucket, and the third times. That procedure would most likely correct the error. Finally, another limitation in the experiment was the uncertainty of the heights, while we tried to keep the height uniform, we hand drilled the holes and there is a slight difference. Perhaps a suitable way to correct this would be to draw the openings on the bucket with the uniform heights, and then attempt to drill there (even with this method it leads to error). If we were to conduct a similar investigation, we would correct these limitations to the extent that we could in hopes for even more accurate results.
Appendix A. Raw Data
|
Drill Bit Size (in.)(+/- .002) |
Trial 1 (s) (+/- .339s) |
Trial 2 |
Trial 3 |
|
11/64 |
252.9 |
253.21 |
252.18 |
|
3/16 |
213.57 |
212.55 |
211.67 |
|
13/64 |
184.77 |
184.36 |
183.69 |
|
7/32 |
163.95 |
162.51 |
161.03 |
|
15/64 |
138.54 |
138.77 |
137.98 |
|
1/4 |
124.42 |
124.81 |
122.99 |
|
17/64 |
105.89 |
107.88 |
105.47 |
|
5/16 |
74.14 |
74.21 |
72.85 |
|
3/8 |
54.30 |
54.33 |
55.10 |
|
1/2 |
29.67 |
29.33 |
29.88 |
Known Values (for the bucket):
Height= .97 m
Radius= .13 m
Therefore Volume= .00515 m3
http://hyperphysics.phy-astr.gsu.edu/hbase/ppois.html - This website possesses interesting information on Poiseuille’s Law that we then used for our background information.
http://www.academia.edu/9795949/Effect_of_Water_Height_to_Water_Flow_Rate_on_Dispenser - We used this website because of its accurate portrayal of volumetric flow rate in an experimental environment.
https://www.khanacademy.org/science/physics/fluids/fluid-dynamics/a/what-is-volume-flow-rate - The equations and their explanations helped us figure out which calculations to use in our experiment.
http://slideplayer.com/slide/7015666/ - This website was helpful in our determination of the variables in our investigation. Additionally, it helped refresh our knowledge of fluid mechanics and properties.
http://slideplayer.com/slide/8909307/ - What we found interesting about this website was its in-depth explanation and diagrams of the continuity equation.
"Fluid Flow Continuity and Bernoulli's Equation." SlidePlayer. SlidePlayer, n.d. Web. 22 Jan. 2017.
Giancoli, Douglas C. Physics. 6th ed. Upper Saddle River, NJ: Pearson Education, 2009. Print.
Guedri, Kamel Mohamed. "Fluid Mechanics." SlidePlayer. SlidePlayer, n.d. Web. 22 Jan. 2017.
"Half-life." Wikipedia. Wikimedia Foundation, n.d. Web. 22 Jan. 2017.
"Poiseuille's Law." Hyperphysics. C.R. Nave, n.d. Web. 22 Jan. 2017.
Putra, Ega Yohanda. "Effect of Water Height to Water Flow Rate on Dispenser." Academia. Academia, n.d. Web. 22 Jan. 2017.
"What Is Volume Flow Rate?" Khan Academy. N.p., n.d. Web. 12 Nov. 2016.