Kicking a Football: How does the kickers distance from the ball affect the ball’s velocity and distance traveled?
By Malachi Seib
Subject: Physics HL
IB Number: 000671 0015
Background | Statement of Problem | Hypothesis | Experimental Setup | How The Data Was Gathered | Diagrams | Results | Conclusions | Links | Bibliography | Research
Background .:.Top
In possibly one of America’s most popular games today, American Football, one of the most underappreciated positions is the kicker. This player only ever sees action is when their team is kicking the ball to the other team, known as a kickoff, after their team scores a touchdown, this is an extra point, or to kick field goals, when a touchdown isn’t a valid option. Being a great kicker is no easy task though, the ball must be kicked perfectly to maximize “the velocity, angle of kick, and the rotation of the ball” (Physics). This is an incredibly under appreciated skill in the game, and something that warrants further investigation by the physics community. The “Kickers Dilemma” states that “he must choose a launching angle, somewhere between the extremes of 45° and 90~ that provides the best strategic combination of distance and hang time” (Brancazio 1985). Now considering that in a game time situation where a kicker typically only has about three seconds to get the ball off before the defense comes rushing in to try to get the ball from them, there is no possible way that the kicker has time to measure out the angle of the planned kick; therefore, the best available option is simply to practice until everything else is perfected. Despite “Kickoffs show much less variability than punts” (Brancazio) it is still important to perfect your kick and everything leading up to it.
Now, considering there is so many moving parts involved in something that as complicated as kicking a football, we will only be examining the distance from which the kicker starts his approach to the ball. This should provide me with valuable data as timing is everything in this aspect of the game. For the simplicity of this experiment we will be “disregarding shape, spin, and mass of the ball, as well as air resistance” as (Swenson 2013) suggests doing for something this complicated. As Hartschuh (2002) suggests that the initial velocity can be calculated and that the whole project can be used in accordance with simple projectile motion. Also, Brancazio (1985) does suggest that in order to have a more predictable flight the ball should travel end-over-end. If we can accomplish this the reliability of the whole project will be greatly increased and easier to calculate. The final point of discussion is the approach to the ball. Often times, in games, kickers will take “3 steps back, 2 steps over” (Field) to kick a field goal. The hope is that by the end of the experiment it will be evident what kind of value the approach to the ball has on the overall outcome of the kick.
Statement of the Problem .:.Top
The purpose of this investigation is to determine whether or not the distance from the ball a kicker stands prior to the kick affects the velocity of the ball and distance it travels.
Hypothesis .:.Top
I believe that (with the distance from the ball being the independent variable and distance traveled/velocity being the dependent variable) that when the kicker is closest to the ball then this is when its velocity will be the lowest and this is also when it will travel the shortest distance.
Experimental Setup .:.Top
The experimental Setup for this lab was relatively simple. In order to complete this Lab myself and two friends went out to the turf field at Tualatin High School with a football, a measuring tape, some phones for timing and data storage, and rain gear. After the kicker, my friend, was warmed up, we began. The experiment looked like this, one individual, myself, held the football, another individual stood about 25 yards out with his phone, ready to time how long the ball was in the air, and finally my other helper lined up as the kicker (As can be seen in a diagram later on). Throughout the experiment the distance away from the ball was manipulated, and at each distance five trials were conducted, totaling 25 trials.
How The Data Was Gathered .:.Top
Gathering the data was a relatively simple task. As soon as the kicker made contact with the ball, the designated timer began the time, when the ball hit the ground again, the time was stopped. This was then recorded. The spot where the ball made impact with the ground was also marked off. Then the distance it traveled vertically would be measured and then the distance horizontally it traveled would be measured. These data values could then be plugged into Pythagorem's Theorem (a^2+b^2=c^2) to find the distance the ball traveled. This was repeated every for every trial, and at the conclusion of the data collection, the information gathered was plugged into the equation ((x/t)^2+((gt)/2)^2)^.5 with G= Gravity, X= Distance traveled, and T= Time to get the initial velocity.
Diagrams .:.Top
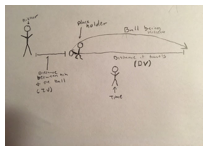
The setup of this experiment is relatively simple, as one can see. The most important thing to note is the experimental design. When looking at the photo to the right, one can see that the distance between the kicker and the ball is the Independent Variable. During this experiment that distance was manipulated five different times, with the distances ranging from just under 10m to just under a 1/2m. At each different distance five trials were conducted and the distance the ball traveled as well as the amount of time the ball was in the air was recorded and analyzed.
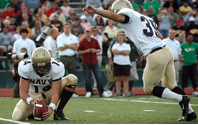
Below, I have included a photo of what the kick would look like in an actual game. This should serve to help see what the actual kick might look like.
 |
Results .:.Top
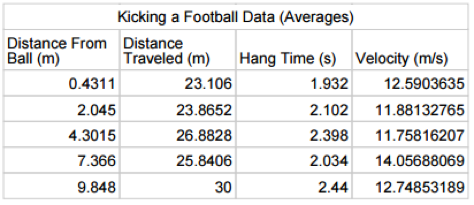
Below is a chart of the average data collected, and calculated from the five different distances that were used as the starting spot for the kicker. It is important to note that the distance away from the ball was calculated using Pythagorean's theorem as we measured a distance straight back from the ball and then a straight horizontal distance to the left of the ball.
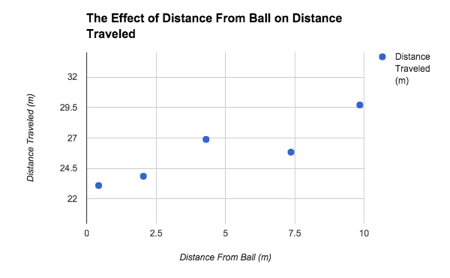

The above charts display the distance traveled by the ball at the different distances the kicker was from the ball. The first one does not have any error bars while the second does.

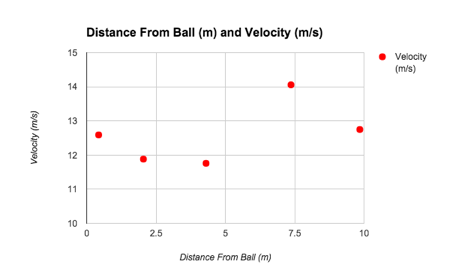
The above charts display the velocity of the ball at the different distances the kicker was from the ball, the first graph has no error bars, while the second does.
The uncertainty used for each graph was (High-Low)/2. This number was used because it acknowledges that some things could have affected the data including air resistance, changes in the weather, such as rain and wind, yet isn’t so large that it takes away from the actual data that was gathered, and for the most part consistent. Especially since actual data was used.
Conclusions .:.Top
After analysing my data I can say that my data did not support my hypothesis. The velocity did not follow general upward trend but followed a more sine like pattern. The lowest velocity was not when the kicker was closest to the ball and when the kicker was farthest from this was not the highest velocity either. Now, in regards to the distance the ball traveled, I also hypothesized about that incorrectly as well, I thought that the ball would travel farthest when the ball had its highest velocity. It actually ended up being that when the ball had the highest velocity, the distance the ball traveled was in the middle of the high and low ends.
Beyond just the fact that my data didn’t support my hypothesis, many other interesting things could be drawn. One of those being that having a higher velocity did not directly correlate to having the kick go farther, in fact when looking at the graph the local minimums for the velocity ended up being the local maximums for the distance the ball traveled. The other interesting thing that can be seen in the data was the relationship between hang time and velocity/ distance traveled. After analyzing the data one can see that when the time spent traveling through the air, hang time, was very high the ball traveled farther but also had a lower velocity.
Now the real question becomes what does all this data mean and how is it actually applicable. As previously mentioned the graph had a couple local maximums for the distance traveled. They were (4.3015, 26.8828) and (9.848, 30). The interesting thing about these points is they also rest at the approximate starting place for a kicker when they either kick a field goal or kickoff to the other team. The interesting thing is these data points were also local minimums on the graph for velocity and had significantly higher hangtimes. This could mean that velocity has less to do with the distance the ball travels and more to do with the time it spends in the air. Also, based on the information that these two points that are local maximums for distance traveled, I would hypothesize that these actually line up with the strides of a kicker and causes them to smoothly transition into the kick when they get to the ball. Another possible conclusion as to why the ball has relatively low velocity when it travels a farther distance is because a longer hang time does bring the overall velocity, yet is necessary for the ball to travel a further distance. Finally, well trained kickers may actually try to have this, lower velocity with higher hangtime because it allows their teammates more time to react to what is happening on the field and respond accordingly.
Now with any good experiment there exists the possibility for error. After reflecting upon how the experiment was conducted several possible errors were discovered. For example, the kicker, despite him being very consistent in his kicks, he is not a professional kicker. This means that there does exist the possibility that his kicking could be more inconsistent than say an NFL kicker. Also, given that my tape measure only provided information in feet, everything had to be converted into meters before it could be analyzed which does leave room for the possibility of an error occurring that could sway the data. Finally, marking the spot at which the ball made initial impact. Since nobody was there to catch the ball it was up to the timer to watch and see where the ball landed and accurately mark this off. The best way to eliminate these possible errors if the experiment were to be conducted again is to: 1) use a tape measurer that has meters so that no conversion from yards to meters is necessary, 2) to get incredibly accurate data a kicker with more experience should be used, and 3) have someone catch the ball so that you can get a more accurate mark as to where the ball landed.
If I were to conduct further research into this topic I would likely conduct more trials with the kicker even farther back from the ball to see if the sine like pattern of the graph would continue you even when the kicker gets very far away from the ball. Another possible research idea is investigating whether the placement of the plant foot has more to do with the distance traveled and velocity of the ball as this is an equally important part of completing a successful kick.
Links .:.Top
http://www.carroll.edu/library/thesisArchive/SwensonR_2013.pdf
The reason that I found this website interesting was that it described the very emotional aspects of kicking, but then went into the physics behind it. On top of that it addressed other factors of what affects kicking that I didn’t look into.
http://www.wired.com/2013/03/how-difficult-is-a-70-yard-field-goal/
I added this website because it looked at what it takes to actually kick a good field goal, and all the different parts of physics it uses. I thought this was beneficial because it showed that my study was on the right track, but definitely could have benefited from accounting for more variables.
http://www.popularmechanics.com/adventure/sports/a8610/anatomy-of-a-field-goal-15044000/
I found this website useful because it addressed something I didn’t really think would have been that important which was me being the holder. It talked about how important being a consistent holder is for a good kick, and this may have affected my data as much as the approach did.
http://physics.wooster.edu/JrIS/Files/Ryan.pdf
I chose to add this website to my related links because it helped with the basis of my project. It gave me the basic ideas how to conduct the experiment, what to measure, and some potential variables to consider.
This last website seemed like a good one to use because it drew some connections between the soccer kick and the field goal and how using a soccer kick is more affective, which I just found interesting, seeing that the two sports overlap more than one might think.
Bibliography .:.Top
Brancazio, Peter J. "The Physics of Kicking a Football." The Physics Teacher Phys. Teach. 23.7 (1985): 403. Web.
"Experimental Uncertainties (Error." Experimental Uncertainties (Errors)(n.d.): n. pag. Experimental Uncertainties (Error. Notre Dame. Web. 22 Jan. 2016.
Field Goal Technique - The Kicker's Corner." The Kickers Corner. N.p., n.d. Web. 10 Mar. 2016.
Hartschuh, Ryan D. "Physics of Punting a Football." (n.d.): n. pag. 2 May 2002. Web. 03 Dec. 2015.
"Physics in Football." Physics in Football. N.p., n.d. Web. 04 Dec. 2015. http://www2.hesston.edu/Physics/PhysicinFootball/index.htm
"Physics of Punting." Physics Related to American Football. N.p., n.d. Web. 03 Dec. 2015. http://ffden-2.phys.uaf.edu/212_fall2009.web/Alexander_Lauritzen/Punting.html
Swenson, Ryan. "Football in Flight: A Study of the Math and Physics of the Trajectory of a Kicked Football." (2013): n. pag. Web.