IB Physics HL Internal Assessment: Introduction | Problem | Hypothesis
| Methodology | Procedure | Data
| Analysis | Graphs | Links
| Conclusion | Bibliography | Appendix | Return to Research
Viscosity: a Study of
Temperature and Flow Rate of a Fluid
Introduction
.:. Top
Viscosity is a physical trait of all liquids, gases, and solids, but for the purpose of this study liquids will be the main focus. The fluid property of viscosity specifically refers to a substance’s resistance to flow, usually in context of it interacting with a solid object. Inside a fluid, particles are moving at different velocities. When a fluid passes through a narrowing solid object, the particles closer to the walls of the solid boundary slow down while the rest of the particles accelerate (“Absolute”). Because particles are changing velocity within a fluid, it’s under stress. Viscosity measures that stress in the units of Pas, and 1 Pas= 1 kg/ms (Viswanath).
Today, viscosity is referred to as a measure of the “thickness” of a fluid but not its density. Thickness can be an indicator of a higher viscosity (“Oil”). For example, “water at 20 °C has a viscosity of 1.002 mPa·s, while a typical motor oil could have a viscosity of about 250 mPa·s” (Serway), which is expected because motor oil is known to be thicker than water.
Viscosity is important to industries that work with fluid dynamics and when fluids are needed to move through a system for a variety of reasons (Long). A common application of viscosity can be seen every time a heavy door closes slowly with the assistance of paddles turning through a viscous oil. A more cosmetic purpose would be lotion: it would not spread across the skin if it weren’t viscous.
Factors that impact the viscosity
of a fluid would be their attractive forces between the molecules. These are
responsible for making the fluid more resistant to flow. The stronger the
forces are the higher the viscosity will be. This is why raising the
temperature of the liquid can decrease its viscosity. As temperature rises, the
attractive forces between molecules weaken, and the molecules are freer to
move. Oppositely, if the temperature decreases, then the molecules slow down,
and the liquid becomes more viscous. The effect of temperature on viscosity can
be identified with flow rate or the rate of flow of a liquid.
This topic is of personal interest as I’m learning about mechanics as an owner of an older car and must maintain its decrepit engine. The question stuck me once about why there were so many different oils for a car. When I discovered viscosity was the main difference between these oils, I wanted to know more. This led me to the investigation of temperature changes and flow rates.
Statement of the problem .:. Top
The purpose of this investigation is to find out the relationship between the flow rate of a fluid and temperature.
Hypothesis .:. Top
I believe that the flow rate of a fluid will gradually increase as the temperature increases. This will happen because as the temperature rises, the bonds holding the molecules closer together will gradually weaken and allow the viscosity to decrease. The independent variable of temperature will be measured in degrees Celsius. The dependent variable flow rate, or the rate at which the viscous fluid will move, will be defined in terms of mL/s and measured with a timer. The controlled variables include but are not limited to the amount and type fluid used in each trial, distance of fluid travel, and the size of the opening for the fluid to travel through.
Methodology .:. Top
Materials Needed for
Experiment:
· 400mL of corn syrup
· one 50mL beaker and one 200mL beaker
· one plastic funnel
· two thermometers
· one ring stand and one clamp
· one hot plate
· a pair of goggles for safety
· a pair of tongs to handle hot glass
Procedure .:. Top
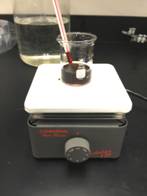
Figure 1: heating 20mL of syrup while monitoring temperature change
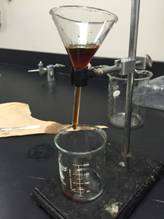
Figure 2: example set up
Assemble the ring stand, clamp, and funnel so the bottom of the funnel is a few inches from the base of the stand. Place the 200mL beaker under the
bottom of the funnel, so it will catch the syrup throughout the experiment and make the clean up easier. Wear goggles and measure out 20mL of syrup into the 50ml beaker. Record measurement and note the error of the beaker. Place 50ml beaker with the syrup onto the hot plate and wait till temperature reaches 30°C while stirring frequently to evenly heat the syrup. Measure the temperature, and quickly pour the heated syrup into the funnel (which needs to be kept in a constant lukewarm water bath to prevent the funnel from taking heat away from the syrup) and start timer precisely when the syrup flows out the bottom of the funnel. When the syrup stops flowing smoothly, to avoid inaccuracy, stop timer and record time in seconds. Then wash funnel with hot water to avoid any errors from having cool syrup remaining from any previous trials. Repeat until all trials are completed from temperatures 30°C to 70°C in 5°C increments. Repeat each temperature variation at least three times. When finished, clean lab station, wait for hot plate to cool, return supplies, and throw away the used syrup.
Methods taken for the consideration of significant influencing factors of this experiment include the following: in regard to relevance of data, only the time, volume, and temperature were recorded so data could be analyzed as a change in mL/s for every 5°C. Small temperature changes provided 9 variations which is a sufficient amount of data for analysis, and the accuracy of this data was addressed with the recording and calculations of average uncertainty and the methods mentioned above. The use of insulated materials like the plastic funnel assists the prevention of heat loss, but this is inevitable in the experiment. As a safety precaution, goggles were worn throughout the whole experiment for there’s a risk of the hot syrup splashing.
Data
and Results .:. Top
Table 1: all collected data from the experiment.
|
Time t/sec Δt = ±.005 |
||||||
|
Temperature T/°C ΔT=
± 0.5 |
Trial 1 |
Trial 2 |
Trail 3 |
Trial 4 |
Trial 5 |
Average of Trials t/sec |
|
30 |
78.71 |
84.21 |
69.9 |
74.5 |
80.29 |
77.52 ± 4.3 |
|
35 |
63.22 |
50.97 |
61.08 |
57.55 |
50.23 |
56.61 ± 5.8 |
|
40 |
46.26 |
39.37 |
45.72 |
39.22 |
38.61 |
41.83 ± 3.4 |
|
45 |
40.48 |
36.29 |
37.71 |
34.5 |
32.44 |
36.28 ± 3.6 |
|
50 |
28.7 |
32.53 |
27.09 |
24.89 |
31.07 |
28.85 ± 3.4 |
|
55 |
25.67 |
20.44 |
25.68 |
23.99 |
21.03 |
23.36 ± 2.3 |
|
60 |
21.72 |
19.48 |
19.2 |
19.96 |
16.32 |
19.33 ± 2.4 |
|
65 |
18.9 |
16.45 |
17.84 |
18.71 |
18.39 |
18.05 ± 2.1 |
|
70 |
17.63 |
17.56 |
18.06 |
17.9 |
16.9 |
17.61 ± 0.5 |
Table 2: Calculating uncertainty for the average
trials.
|
Averaged Trials t/sec |
Range |
|
|
77.522 |
9.71 |
4.342444012 |
|
56.61 |
12.99 |
5.809304606 |
|
41.836 |
7.65 |
3.421184006 |
|
36.284 |
8.04 |
3.595597308 |
|
28.856 |
7.64 |
3.41671187 |
|
23.362 |
5.24 |
2.34339924 |
|
19.336 |
5.4 |
2.414953416 |
|
18.058 |
2.45 |
1.095673309 |
|
17.61 |
1.16 |
0.5187677708 |
To find the
uncertainty of the average trials the equation ![]() .
.
The calculation of
the flow rate is ![]() , which gives the units mL/s.
, which gives the units mL/s.
Final
Quantitative Data for Analysis .:. Top
Table 3: the effect of temperature on flow rate,
Full calculations with errors can be found in Appendix
II.
|
Temperature T/°C ΔT=
± 0.5 |
Flow
Rate mL/s |
|
30. |
0.26
± 0.05 |
|
35. |
0.35
± 0.08 |
|
40. |
0.48
± 0.99 |
|
45. |
0.55
± 0.12 |
|
50. |
0.69
± 0.17 |
|
55. |
0.86
± 0.19 |
|
60. |
1.0
± 0.25 |
|
65. |
1.1
± 0.20 |
|
70. |
1.1
± 0.17 |
Qualitative Data: While conducting this experiment, I noticed that as the temperature of the syrup increased,
it was easier to stir the liquid and faster to pour it into the funnel.
Graphs
of the Data .:. Top
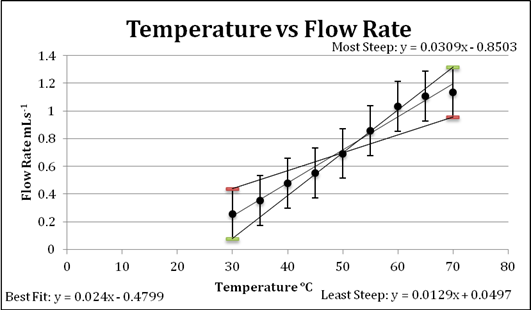
Graph 1: a linear treatment of the data
The purpose of this graph is to demonstrate the nature of the collected data, which is that there is a definite positive correlation between temperature and volume velocity. The minimum and maximum slope lines were found digitally and incorporated into the graph.
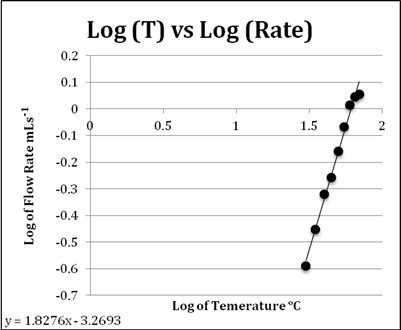
Graph 2: a logarithmic treatment of the data
If ![]() ,
then
,
then ![]() ,
so
,
so ![]() X
X ![]() and
and ![]() .
.
This means that the relationship of temperature and flow rate for
this experiment has
an equation of ![]() .
.
The graphs above demonstrate that there is a relationship between temperature and volume velocity or flow rate of the fluid used. This relationship is that as the temperature of a fluid increases so does its flow rate. Between the starting and final temperature, a difference of 40°C, the increase in flow was 400%, which is a fairly significant change in the fluid’s ability to flow.
The line of best fit can be defined a logarithmic equation as it demonstrates the relationship and effect of increasing temperature on flow rate while taking into account the limit of the liquid as it approaches a change of state. When the temperature gets closer to the boiling point of the liquid, the rate of change in flow noticeably decreases, suggesting there is a limit to the rate at which this syrup can flow, which can be assumed to be somewhere near its boiling point. With the errors included in this graph, it is evident that the data despite its uncertainties also supports the conclusion stated above.
Conclusion
.:. Top
My hypothesis was proven correct by the results establish with data from this experiment. I believed that the flow rate of a fluid would gradually increase as the temperature increased. The graph of the data from this experiment demonstrates a positive correlation proving the hypothesis correct and answering the research question. Viscosity will decrease allowing a fluid to flow faster as temperature increases. A theory that helps explain the results from this study is the Kinetic Theory of Heat, which states “atoms in molecules are in a state of continuous motion” (“Heat”). This motion or kinetic energy can be averaged and provide us with the measurement of temperature. As these molecules are heated, they move faster. Bonds between molecules can actually break which allows for state changes such as liquid water turning into steam. However, this wasn’t the purpose of this investigation, and certain precautions were taken to avoid a change of state for the significance of the data collected and for the safety of conducting the experiment. The syrup was not raised to its boiling temperature, which is close to that of water, and the maximum recorded temperature was at 70°C. The Kinetic Theory of Heat assists the understanding of what’s happening molecularly as it provides a conceptual knowledge about molecular physics. As a liquid, in this case syrup, is heated, the bonds holding the molecules together and responsible for making the liquid more resistant to flow or more viscous, start to weaken. As the syrup was heated, the weakening bonds and accelerating particles allow the liquid to flow faster.
The strengths and weaknesses of the investigation are discussed below. The strength of this study was that there was a clear manipulation of the independent variable directly indicating a cause and effect relationship. Also, the procedure for this lab can be easily replicated. A weakness is that there wasn’t total control over all the variables. This led to some substantial errors that are evident in the graph. These errors include inconsistencies within the syrup because it crystalized or separated when heated and cooled and inaccuracies of measuring volume and timing, which are human errors. Systematic errors in this lab were a significant contributor to the final uncertainty, as the equipment used for this investigation didn’t provide precise measurements that were easy to keep exact for each trial. Heat loss from the system was the most challenging of errors to control and was a large source of systematic error, which could have had a larger impact on the small sample of syrup verses if a larger sample was used.
A few suggestions for the improvement of this investigation would be an increase in the syrup used to slow heat loss and incorporating more liquids of varying viscosities to demonstrate the universality of the relationship found in this investigation. In addition the speed at which the each trial and variation is conducted has significant impact on the temperature of the syrup because the glass beaker used to heat the liquid cools rapidly which alters the results. To reduce some of the systematic errors, use more precise beakers and a digital thermometer.
A suggestion for the extension of this investigation would be to apply it to fluid mechanics. With respect to heat and motion, a study could be conducted to find the perfect viscosity and temperature of one of the liquids within an operating car engine to optimize the efficiently of a particular mechanical operation.
Links
.:. Top
http://www.engineeringtoolbox.com/dynamic-absolute-kinematic-viscosity-d_412.html - This site provided me with background information on viscosity and discussed possible uses and experiment as well. It was very useful, which was why I mentioned it in my Internal Assessment.
http://www.tutorvista.com/content/physics/physics-i/heat/heat-and-motion.php - This was a very simple webpage which provided me with very clear and well worded definitions of the vocabulary and topics that were discussed in my paper.
http://ezinearticles.com/?Why-Measuring-Viscosity-is-Important-For-Many-Industries&id=3263515 - IB loves to have real work connections and applications mentioned and incorporated into our work. This source was therefore important to me as it provided more information on why viscosity was important in specific industrial processes and products.
http://www.kewengineering.co.uk/Auto_oils/oil_viscosity_explained.htm - Similar to the source above, this one gave me a little more specific information using actual numeric values to discuss other physical traits which are related to viscosity.
http://www.springer.com/us/book/9781402054815 - This was an actual book that had everything about viscosity in it. Useful.
http://physics.info/viscosity/ - This is a physics textbook on line. It’s got cool equations in it and everything.
http://www.research-equipment.com/viscosity%20chart.html - This one has viscosities of syrup on it. They are really big numbers.
Bibliography
.:. Top
"Absolute, Dynamic and Kinematic Viscosity." Absolute,
Dynamic and Kinematic
Viscosity. The Engineering Toolbox, n.d. Web. 15 Nov. 2015.
"Heat and Motion (Kinetic Theory of Heat)." Heat and Motion (kinetic Theory of Heat). TutorVista, Web. 16 Jan. 2016.
Long, Andrew K. "Why Measuring Viscosity Is Important
For Many Industries." Ezine
Articicles. 13 Nov. 2009. Web. 1 Dec. 2015.
"Oil Viscosity Explained." KEW Engineering. N.p., n.d. Web. 01 Dec. 2015.
Serway, Raymond A. (1996). Physics for Scientists & Engineers (4th ed.). Saunders
College Publishing.
Viswanath, D. S. Viscosity of Liquids: Theory, Estimation, Experiment, and Data.
Dordrecht: Springer, 2007. Print.
Appendix
.:. Top
Appendix I
Calculations for finding the volume velocity.
|
V (mL) |
t(s) of trials |
mL/s |
|
20. |
77.522 |
0.2579912799 |
|
20. |
56.61 |
0.3532944709 |
|
20. |
41.836 |
0.4780571756 |
|
20. |
36.284 |
0.5512071436 |
|
20. |
28.856 |
0.6930967563 |
|
20. |
23.362 |
0.8560910881 |
|
20. |
19.336 |
1.034340091 |
|
20. |
18.058 |
1.107542363 |
|
20. |
17.61 |
1.135718342 |
Appendix II
Table 2 expanded: complete calculations of flow rate and final uncertainty
|
Averaged Trials t(s) |
Volume of syrup V(mL) |
Flow Rate (mL/s) |
error of T(s) |
error of V(mL) |
%error of T(s) |
%error of V(mL) |
∑ % error |
Fianl uncertainty (mL/s) |
|
77.522 |
20 |
0.2579 |
4.3424 |
2.5 |
0.0560 |
0.125 |
0.1810 |
0.0467 |
|
56.61 |
20 |
0.3532 |
5.8093 |
2.5 |
0.1026 |
0.125 |
0.2276 |
0.0804 |
|
41.836 |
20 |
0.4780 |
3.421 |
2.5 |
0.0817 |
0.125 |
0.2067 |
0.0988 |
|
36.284 |
20 |
0.5512 |
3.595 |
2.5 |
0.0990 |
0.125 |
0.2240 |
0.1235 |
|
28.856 |
20 |
0.6930 |
3.416 |
2.5 |
0.1184 |
0.125 |
0.2434 |
0.1687 |
|
23.362 |
20 |
0.8560 |
2.343 |
2.5 |
0.1003 |
0.125 |
0.2253 |
0.1928 |
|
19.336 |
20 |
1.0343 |
2.414 |
2.5 |
0.1248 |
0.125 |
0.2498 |
0.2584 |
|
18.058 |
20 |
1.1075 |
1.0956 |
2.5 |
0.0606 |
0.125 |
0.1856 |
0.2056 |
|
17.61 |
20 |
1.1357 |
0.5187 |
2.5 |
0.0294 |
0.125 |
0.1544 |
0.1754 |