Sarah Lemieux, Ann Kuan, Jennie Shen, Alyssa Fuji
IB Physics II
Murray
1/13/14
A difference in electrical potential is needed in order to produce an electric current in a circuit. This change in electrical potential can be created by connecting the ends of a wire to the positive and negative terminals of a battery. When charge flows through the wire, electrons flow from the negative to the positive terminal of the battery. The current, measured in Amperes, is impeded by the resistance in the wire. Resistance, which is measured in Ohms, is caused by collisions between atoms as their electrons flow through the wire. Ohm's law shows that resistance is inversely proportional to the current through a wire and directly proportional to the electrical potential, or voltage, which is measured in volts (Giancoli, 2009).
According to Giancoli, all electric devices have an inherent resistance to the current, but this resistance often has a very small effect on the current flow. For this reason, devices called resistors are added to many circuits. Resistors control the amount of current by increasing the resistance in the circuit.
Another related quantity is the resistivity of a material. The resistance of any wire has been shown to be directly proportional to the length of the wire and inversely proportional to the wire's cross-sectional area. The constant of proportionality in this equation is called the material's resistivity and is measured in Ohm-meters. The resistivity is dependent on the material the wire is made of. The higher the resistivity, the higher the resistance will be in a wire with the same length and cross-sectional area.
The resistivity of a material is also partly dependent on other factors, including the temperature of the material. As a metal's temperature increases, its resistivity generally increases as well because the atoms move more rapidly and become more disorderly (Giancoli, 2009). The resistivity of insulators and semiconductors usually decreases with temperature, and semiconductors can even have a negative resistivity because, at high temperatures, more electrons in the semiconductor can become free and add to the flow of the current. The temperature coefficient of resistivity is an empirical quantity that shows the relationship between a change in the resistance or resistivity of a material with the temperature of that material (Boundless, n.d.).
Nichrome, a non-magnetic alloy, is usually composed of 80 percent nickel and 20 percent chromium. Its boiling point has been measured at about 1400 degrees Celsius, and its resistivity has been measured to range from 1.10E-6 Ohm-meters to 1.50E-6 Ohm-meters. Its boiling point is rather high so it is an ideal conductor and material in making wires. It has a high resistivity. Nichrome is often used in heating devices after being wound into coils (Kwan, 2007).
According to the Wisegeek website, fiberglass is a glass-reinforced plastic material used as an insulator. It is made by bundling thin strands of glass together. It is good at trapping heat, so it can be used to shield electrical wires like the nichrome that will be used in the experiment. This way, the temperature and conditions of the environment will have minimal effect on the measurements on temperature received by the thermocouple.
Statement of the ProblemThe purpose of this investigation is to find the relationship, if any, between the temperature of a nichrome wire and that wire's measured resistance.
HypothesisWe believe that increasing the temperature of the nichrome wire will cause the measured resistance of the wire to also increase. This is because nichrome is composed of metals, and the resistivity of metals generally increases with temperature (Bortner). The resistivity is directly proportional to the resistance, so the resistance should increase with the resistivity.
Temperature is defined as the degrees Celsius of the wire measured with a thermometer.
Resistance of the wire is defined as the voltage divided by the current in the wire.
The controlled variables include but are not limited to the length of the wire, material used to make the wire, cross-sectional area of the wire, the fiberglass used to insulate the wire, the thermometer used, and the room environment in which the experiment is conducted.
The experiment included a piece of nichrome wire of at least 4 inches in length, electrical wiring, a voltage converter, two multimeters, a thermocouple, fiberglass insulation, and a thin glass tube.
Working Setup and Procedure
To set up the experiment, we used a voltage converter as a power source for a circuit. Electrical wiring was used to connect the voltage converter to the multimeters, with one used as a voltmeter and one as an ammeter. The electrical wiring also connected the voltage converter to both ends of a nichrome wire, shown in red in the diagram. The nichrome wire was embedded in fiberglass insulation, which was used to ensure that the outside temperature would have a more limited influence on the measurement gained from the thermocouple. The fiberglass surrounded a glass tube. One end of the thermocouple was put into the glass tube, and the other end was placed in a styrofoam cup filled with iced water in order to create a large temperature difference between the two different ends and provide a more accurate temperature measurement.
To collect data, the voltage converter was used to change the voltage of the circuit, which also caused the temperature change. As the temperature was increased, data from the ammeter and the voltmeter were collected at certain intervals, with the first measurement being taken at room temperature (measured as 23 degrees Celsius), the second being taken at 50 degrees Celsius, and the rest at 50 degree intervals until the temperature of 950 degrees was reached. 950 degrees Celsius was decided as the maximum so that the glass would not break as the nichrome reached an extreme temperature.
In order to calculate the resistance, we utilized the Ohm's Law formula, which is voltage divided by the current. The results of the data demonstrates that as the temperature increased, the voltage and current increased as well, but the trend broke when it was at 250 and 450 Celsius degrees, which was reflected in our results for resistance; at 250 and 450 degrees Celsius there was a sudden peak.
Data Table| Temperature (degrees celsius) | Voltage (Volts)±0.005 | Current (Amperes)±0.005 | Resistance |
| (Ohm-Meters) V/C | |||
| 23 (Room temp) | 0 | 0 | 0 |
| 50 | 0.39 | 0.46 | 0.858 |
| 100 | 0.7 | 0.72 | 0.972 |
| 150 | 0.9 | 0.93 | 0.968 |
| 200 | 1.1 | 1.14 | 0.965 |
| 250 | 1.71 | 1.4 | 1.22 |
| 300 | 1.65 | 1.67 | 0.988 |
| 350 | 1.79 | 1.8 | 0.994 |
| 400 | 2.02 | 2.02 | 1 |
| 450 | 2.4 | 2.15 | 1.12 |
| 500 | 2.32 | 2.31 | 1 |
| 550 | 2.55 | 2.52 | 1.01 |
| 600 | 2.66 | 2.64 | 1.01 |
| 650 | 2.73 | 2.71 | 1.01 |
| 700 | 2.9 | 2.86 | 1.01 |
| 750 | 3.05 | 3.01 | 1.01 |
| 800 | 3.24 | 3.2 | 1.01 |
| 850 | 3.62 | 3.58 | 1.01 |
| 900 | 3.91 | 3.86 | 1.01 |
| 950 | 4.12 | 4.15 | 0.993 |
As the temperature was increased, the voltage and current increased as well, but at 250 and 450 degrees Celsius, this trend was broken. This was reflected in our results for resistance when there was a sudden peak at 250 and 450 degrees Celsius. The result of our data supports the hypothesis that as the temperature increase, the resistance will also increase, but only very slightly. For example, the resistivity increased from .858 at 50 degrees Celsius to 1.00 at 400 degrees Celsius. This demonstrates that resistance of the nichrome wire, which is an alloy containing nickel and chromium, changes but only by very little compared to other metals such as steel, which has a higher temperature resistance.
Explanation of ResultsOverall the results of the data works in accordance to the rule of Ohm's Law, which states that the resistance is inversely proportional to the current through a wire and directly proportional to volts. The temperature in this case, would also become proportional to the resistance, because it is the heating conductor that is directly affecting the voltage and current. The pattern of the data indicates that as the temperature increases, the voltage and current will also increase and therefore, the resistance will, as a result, increase. Although the hypothesis was correct, the experiment did not clearly show the relationship of the temperature being proportional to the resistance because according to temperature coefficient of resistance, the resistance- change factor per degree Celsius of temperature, the metal nichrome, is not as effective compared to other metal alloys such as steel. As shown in this picture:
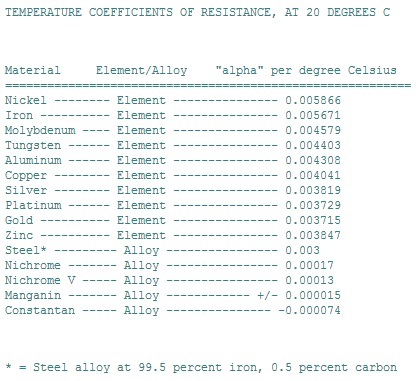
The temperature coefficient of resistance for nichrome is only 0.00017 while steel is 0.003, which is significantly higher than nichrome. This shows that nichrome, is not as an effective of a resistance heating conductor as those of other metals and give reasons to why the rate of increase was so low. If another wire was used in replacement of nichrome, then the result might have been different. A metal of higher resistance might have demonstrated a better relationship for the lab than the nichrome that was used.
ErrorsOne potential reason for error was that since the temperature was constantly changing, it was difficult to measure the voltage and current extremely accurately. The insulation could've also been a cause of error since we didn't fully wrap it around the fiberglass tube since we wanted to see how red the wire was getting. As the wire got hotter, it would burn the insulation, so that caused layers of insulation to fray, which might impact the resulting temperature of the wire. The ice in the styrofoam cup was constantly melting so the balance between it and the heated wire might not have been sustained throughout the whole experiment.
ImprovementsIf we were to do this experiment again, one thing we could do is to do multiple trials in order to get a more accurate voltage and temperature measure. Also, considering the fact that the melting temperature for nichrome is 1,400 degrees Celsius, we definitely could've had a wider range of temperatures rather than stopping at 950 degrees. We could also try adding more layers of insulation so that as it burns out, there will still be enough to insulate it. As for the ice, we should have a thermometer in the ice water to regulate its temperature and add ice when needed, although it would be difficult to keep the ice temperature exactly the same.