Aaron Scherer
Joshua Jesser
Matias Silvestre
Tony Terjeson
PRO-JECT MAGIC
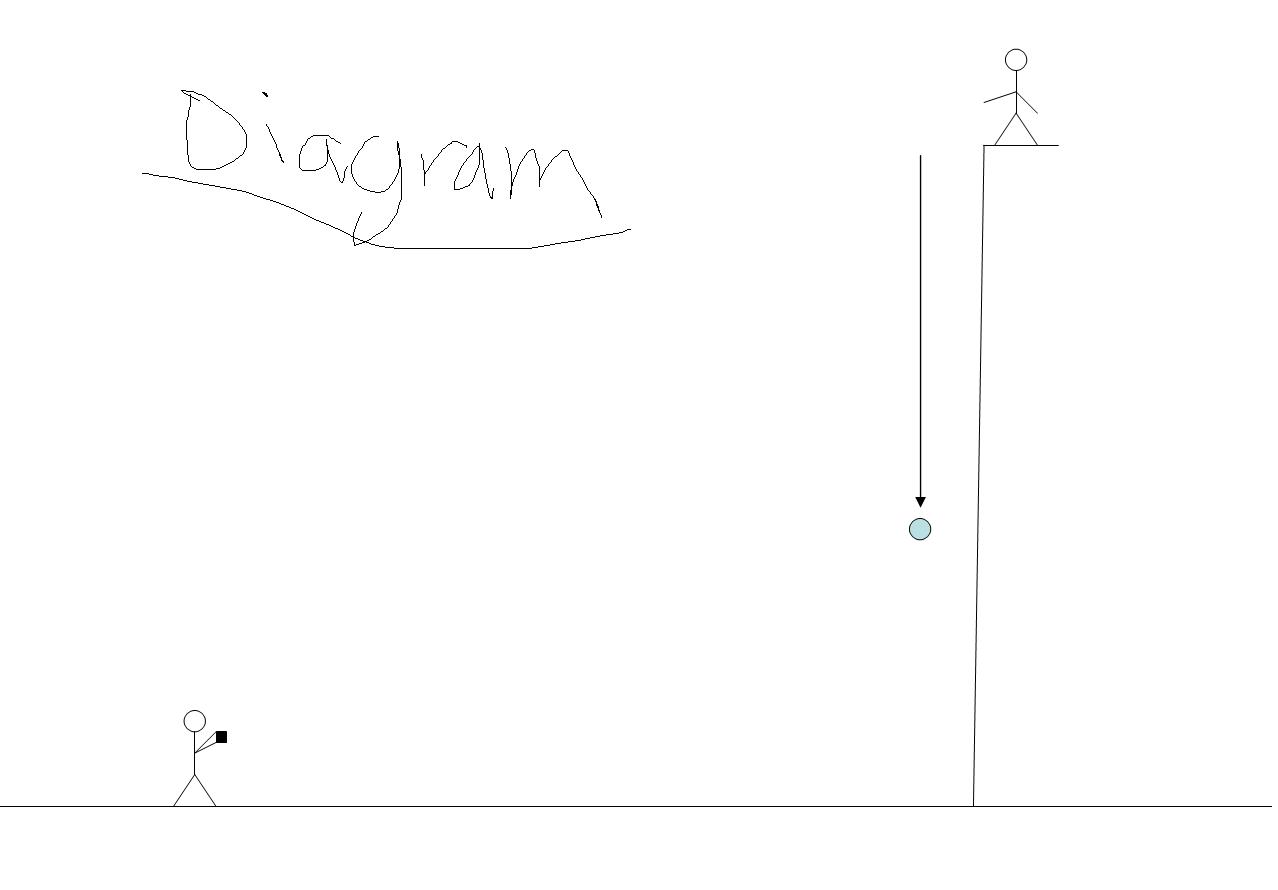
Background Problem Hypothesis Method Diagram Results Graphs Conclusion Meaning of Life (watch in 1080p) Go Up
Background
In free fall, all objects will accelerate at the same rate regardless of size,
mass, or
shape. This was proven by several scientists. The most common experiment to
prove this is
where two objects of the same shape but different masses are dropped from the
same height and
then both hit the ground at the same time. In Galileo’s experiment, he used
inclined planes to
slow down the acceleration to measure the elapsed time more accurately. The ball
was allowed
to roll a previously measured distance down a ramp, and the time was recorded.
Galileo showed
that the motion on an incline plane had a constant acceleration which was
dependent only on the
angle of the plane, and not the mass. Unfortunately, Galileo couldn’t prove that
free fall motion
behaved the same way. In fact it is possible to describe a free fall motion as
an inclined plane
motion with an angle of 90. Using Newton’s laws we can prove Galileo’s theory.
We can split
the gravitational force acting on the rolling balls into two vectors: one
horizontal and one vertical
(Rubin). Although it is commonly belief that Galileo did an experiment where he
dropped two
objects of different masses from the same height, it was first performed by a
scientist named
Simon Stevin in 1586 (Drake 20). These studies were used in the early 1600’s in
order to
calculate the trajectory of cannonballs shot from a cannon (Stern). It was
proven once again on
the surface of the moon by David Scott, when he dropped a hammer and a feather
at the same
time and they fell at the same rate (Stern). The net force at which an object
falls divided by its
mass will be the same for all objects as this equals their acceleration (The
Physics Classroom).
Our experiment will also be closely related to drag as this is one of the most
important
variables in our experiment. Both mass and shape affect drag; shape can affect
how much drag
and mass affects how much of an effect drag has on the object (Benson).
Different shapes
have what they call drag coefficients, which are used in our calculations to
solve for different
variables such as terminal velocity (Benson). We will try to keep our variables
constant, besides
that of the mass, in order to make our results more valid.
Statement of the Problem
The purpose of this experiment is to determine the relationship of a ping pong
balls mass
and the rate at which it falls. We will also determine the force at which it
falls at and its velocity.
Hypothesis
I believe that ping pong balls with a greater mass will accelerate faster and
have a greater
velocity at the bottom of its fall. I believe this will happen because wind
resistance will have less
of an effect on the ping pong balls as they fall. We will measure acceleration
in meters per
second per second and velocity in meters per second. The control variables will
include where
we throw the ping pong balls off the cliff, the distance at which it falls,
weather, and size of ping
Method: Materials and Procedure
First, we gathered our materials need for this experiment. We needed 15 Ping
Pong balls, a cup of water, a syringe, ruler, and a video camera. We then found
an area that had
very little wind and was about 40-50 feet high (Tualatin High Bleachers). Before
going to that
area, we set up our experiment. We set aside three ping pong balls to be used as
our control.
They would have no water in them. Using the syringe, we filled three ping pong
balls up with 7
ML of water, three with 14 ML, three with 21 ML, and finally three with 28 ML
(basically full).
We took into account that the ping pong ball weighed about 2.7 grams initially,
so we added that
to our final weight of the five different measurements. We then went to the TuHS
bleachers and
filmed the dropping of each ping pong ball. After that we took that film into
Logger Pro to
analyze when the ball reached terminal velocity. Since our video was recorded in
1080P, 60 FPS,
we could have a better analysis in Logger Pro. We could tell when the ball was
at terminal
velocity because the speed of the ball would level off. Once we found the
terminal velocity, we
still needed to find the drag. We used the formula F=pv2CA. F is the force of
drag in Newtons, p
is the mass, v is the terminal velocity, C is the drag coefficient, and A is the
reference area. We
then discovered that the drag coefficient of a sphere was 0.47. The reference
area was found by
taking the radius of the ping pong ball (at its widest place), squaring that,
and multiplying it by
pi; in other words, the reference area was the equivalent of the area of the
largest cross-section of
the ping pong ball. Now all we needed was to plug in our values for terminal
velocity (v) (which
we previously recorded in our experiment) to find the drag.
The top three lines are velocities with an average under them while the next three lines are the forces of drag with an average under them.
Conclusion
We conducted our experiment in order to see the effect that mass has on the
terminal
velocity of a falling ping pong ball. Furthermore, we wanted to see the effect
that terminal
velocity had on the drag the ping pong ball experienced while falling. After
conducting the
experiment and looking at our results, I think it is easy to see that our
results were conclusive.
All of our graphs ended up as exponential or logarithmic showing that our data
followed a trend.
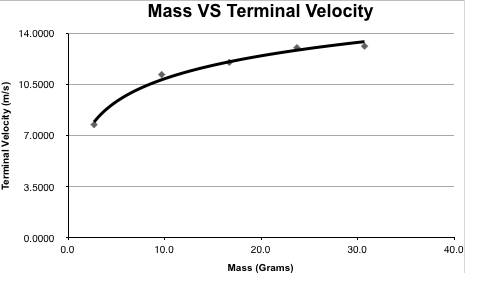
When we matched the mass of the ping pong balls against the terminal velocity
that the ping
pong balls fell with, we saw a logarithmic trend. As the mass got higher, the
velocity got higher
at the start, but eventually the velocity leveled off. This is due to the fact
that at a certain point,
the ping pong ball is getting close to the speed it would fall if it was in a
vacuum, meaning there
is no drag on the ping pong ball. In our experiment, the velocity of the ping
pong ball seemed to
approach a limit of just over 13 meters per second. This is because the combined
force of the
ping pong ball’s mass and gravity was greater than the force of drag on the ping
pong ball. In our
trials where the ping pong balls had a greater mass, the ping pong balls fell as
if they were not
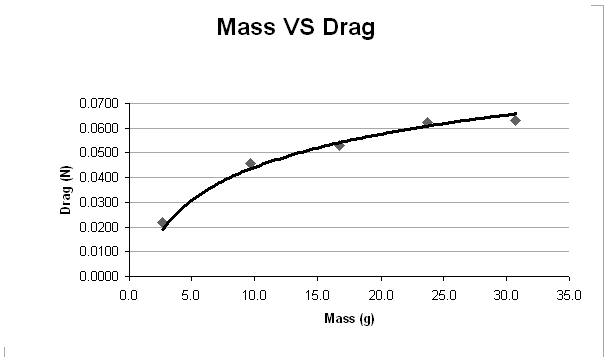
affected by drag, even though the force of drag was still rising. In our next
graph, we tried
velocity versus drag. This time we saw exponential growth in our data. At first
glance, the five
data points seemed to have a linear relationship. If our data was linear, then
there would be a
point at which the ping pong ball had some velocity but no drag. It is only
possible for there to
be an absence of drag if the ping pong ball was dropped in a vacuum, which it
was not.
Therefore, the graph must be exponential in order for there to be drag at all
velocities.

Bibliography
Benson, Tom. “The Drag Equation.” Grc.nasa.gov. 2010.
<www.grc.nasa.gov/WWW/K-12/airplane/drageq.html>
-NASA website about drag and equations relating to it.
Benson, Tom. “Terminal Velocity.” Grc.nasa.gov. 2011.
<www.grc.nasa.gov/WWW/K-12/airplane/termv.html>
-NASA website about terminal Velocity and equations relating to it
Drake, Stillman. Galileo at Work: His Scientific Biography.
The Physics Classroom. “Newton’s Second Law of Motion.” 2011.
<http://www.physicsclassroom.com/class/newtlaws/u2lthreee.cfm>
-Website relating to Newton's second law of motion
Rubin, Julian. “The Falling Bodies Experiment.” Following the Path of Discovery.
2011.
<http://www.juliantrubin.com/bigten/galileofallingbodies.html>
-Stuffs pertaining to Galileo. yeah.
Stern, David. “The way things fall.” From Stargazers to Starships. 2004.
< http://www-istp.gsfc.nasa.gov/stargaze/Sfall.htm>
-Website about falling stuffs