The Music to My Ears:
A Study of Wine Glass Resonance
Researchers:
Lizzie Bellows, Stevie Cade, Anaiis Mendez
Table of Contents Intro .:. Method .:. Results .:. Conclusion .:. Graphs .:. Blibliography .:. Go Up
Introduction: TOC.:.
Since the Middle Ages, various cultures have explored glass music through the use of crystalline bowls and goblets, striking them with covered sticks to produce a multitude of tones (2). But it wasn’t until 1761 that the art was improved by Benjamin Franklin and his creation, the Armonica. The Armonica is a set of 24 glass bowls mounted on a horizontal rod. Each bowl is individually ground until it is in tune, and they are arranged from largest to smallest (1). To produce a tone, all one has to do is push the foot treadle and touch the bowls with moist fingers (3). The Armonica was quite popular until the mid-1800’s, because of mass superstition. People believed that the haunting melodies produced by the instrument would summon dark spirits (1).
These days, it’s much more common to see a person playing a wine glass instead of Franklin’s invention. In order to alter the pitch on an Armonica, one simply has to adjust the size of the bowl, but a wine glass is different; to achieve a different pitch, water must be added or subtracted. When rubbing a finger on a glass, you are setting it into vibration through the use of slip-stick friction. Slip-stick friction is where your finger comes into contact with the glass molecules and pulls them apart until they reach a certain tension. After the tension is released, the finger then finds another spot on the glass and repeats (4).
In our experiment we hoped to determine the relationship between density and volume, and how the density of the fluid in the glass affects the volume needed to achieve a specific frequency. To alter the density, we will add a set amount of sugar to the water. We hypothesize that the volume needed to reach the designated frequency in the sugar glass will be greater than the water glass, because of its greater density. The greater the density, the slower the sound waves should travel. We also believe that the amount of water needed for each consecutive note will be the same; that the difference of volumes between two notes will be the same for all, and that both glasses will follow this pattern.
Method: TOC.:.
Before we began testing, we need a few materials for data collection. We needed a crystal glass, a liquid measuring cup, a set of teaspoons, sugar, a pot to boil sugar water in, and a frequency generating software, in this case NCH Test Tone Generator. Before we could begin, we had to determine the initial resonance frequency of the glass we had. By adding a quarter of a teaspoon of water, we compared the note produced to ones in the generator until we found it to be a high G and that the last note we would theoretically reach would be the G an octave lower. Afterwards, we recorded the volume needed for our high G. We slowly added water by employing the teaspoons and estimated the appropriate volume for the pitch. Because we didn’t have a tuner, we had to proceed by ear. This process of adding and recording ended after we had collected the volumes for notes G, A, B, C, D, E, F#, and G, the set scale.
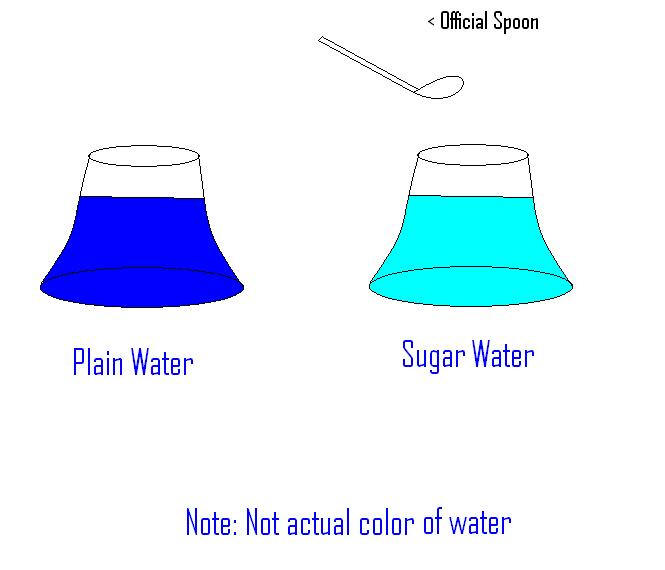
After the plain water test, we prepared for the sugar test. First we set approximately two cups of water to a boil. Two cups because it was a little more than the glass could hold. During the boiling process, some water would be lost, so we had to compensate. Once it reached a boil, we added 24 teaspoons, a quarter of the 96 teaspoons of water total (2 cups = 96 teaspoons). We stirred the mixture until the sugar had dissolved. So as not to shatter the glass by adding the boiling liquid, it had to be run under hot water from the tap until well heated, then dried thoroughly. Afterwards, we repeated the process above of adding and estimating by ear the note produced by the glass.
Diagram:
Results: TOC.:.
Data Table-
Uncertainty: + or - .125
Note ----Frequency------Plain Water Volume (Tsp) -------Differences Between Volumes------Sugar Water Volume---Differences
G 392 81.5 88.0
A 440 75.0 6.50 84.0 4.00
B 493 68.0 7.00 76.0 8.00
C 523 63.0 5.00 70.0 6.00
D 587 55.25 7.75 61.0 9.00
E 659 45.0 10.25 53.0 8.00
F# 740 29.0 16.0 34.0 19.0
G 784 0.25 20.75 2.00 32.0
Graphs: TOC.:. Note, all error bars are on the graphs, but are too small to be seen.
(Below, water graph)
(Below, Sugar Water Graph)
(Below we have a Comparison Graph)
Data File: .:. Excel . :. text
Conclusion: TOC.:.
Results- The sugar water glass did indeed need greater volumes than the plain glass to achieve the appropriate frequencies. Unfortunately the data did not remain stable, and that the differences fluctuated. Even the fluctuations between the two tests weren’t the same.
Our data agreed with our hypothesis up to an extent; The glass with sugar water required more teaspoons than the plain glass, because it’s density did in fact slow down the sound waves. Yet our assumption that the differences between the volumes of the frequencies would be the same turned out to be wrong and that it did not increase in a linear fashion. We believe that this is mostly because of the differences between the frequencies chosen. The notes themselves are consecutive on a scale, but the frequencies don’t increase by a set number each time. For example, the difference between a low G and an A is 48 Hz, but the difference between the same A and B is 53.
If any errors had occurred, it would’ve mostly likely happened during the collection of data. We were comparing the sound produced by a glass to a computer generated sound, by ear. Most people are unable to detect perfect pitches, and it was highly likely that a few of our chosen volumes produced notes that were half a note flat or sharp. We severely regret not having a tuner present that could analyze the sounds produced by the glass. Also, when the teaspoons poured water into the glass, a few drops clung to them. This means that we weren’t really adding the full amount each time, even though the remaining water in the teaspoon was very small.
If this experiment were ever conducted again, we believe that there should be no comparing sounds to a tone generator; either use an electronic tuner or don’t attempt unless you don’t mind accounting for human error. Also, we were only about to find one crystal glass that worked for our experiment. It would be beneficial to have multiple glasses of the same size and shape, so as to avoid the hassle of cleaning over and over again. As for our approach to measuring the water, the teaspoons served us well and we had little to no trouble with them.
RELATED WEBSITES
http://www.gigmasters.com/armonica/history.html Basic history of the Armonica
http://library.thinkquest.org/22254/armonica.htm Info on how the armonica works
http://www.glasharfe.de/glasharfe/texte/history.htm History of wine glass music and how it began
http://www.physicsclassroom.com/class/sound/u11l4a.cfm Explanation of how sound travels through glass and water
http://www.newton.dep.anl.gov/askasci/phy05/phy05119.htm More explanations about sound traveling through different mediums..........
http://physics.info/sound/ And even more explanations!!!!!!!
Bibliography TOC.:.
1) Brauer, Cecilia. "History of the Armonica, Ben Franklin and Glass Armonica." Event Entertainment Booking Agents: Live Music Bands, Wedding Musicians, Party DJs. GigMasters Music Booking Agent and Live Entertainment, 1997. Web. 14 Nov. 2011. <http://www.gigmasters.com/armonica/history.html>.
2) "Glass Music: History." The World of Glass Music. Web. 14 Nov. 2011. <http://www.glasharfe.de/glasharfe/texte/history.htm>.
3) "Glass Armonica." Thinkquest.org. Oracle. Web. 10 Nov. 2011. <http://library.thinkquest.org/22254/armonica.htm>.
4) "Natural Frequency." The Physics Classroom. ComPadre, 1996. Web. 14 Nov. 2011. <http://www.physicsclassroom.com/class/sound/u11l4a.cfm>.
5) "Speed of Sound and Medium Density." NEWTON, Ask a Scientist at Argonne National Labs! Argonne National Laboratory's Educational Programs, 1991. Web. 14 Nov. 2011. <http://www.newton.dep.anl.gov/askasci/phy05/phy05119.htm>.
6) Elert, Glenn. "The Nature of Sound." The Physics Hypertextbook. 1998. Web. 14 Nov. 2011. <http://physics.info/sound/>.