Method and Data
Our goal was to build a catapult that we could use to find a relationship between the force applied to the throwing arm and the horizontal displacement that occurred. We contemplated how medieval soldiers were able to fire a catapult at a variety of ranges instead of the single full draw. We decided that they used varying amounts of force to launch the projectiles at different velocities. In order to do that, they had to pull the arm back to different angles to get the range just right. But how did they know how far to pull it? We decided to find out.
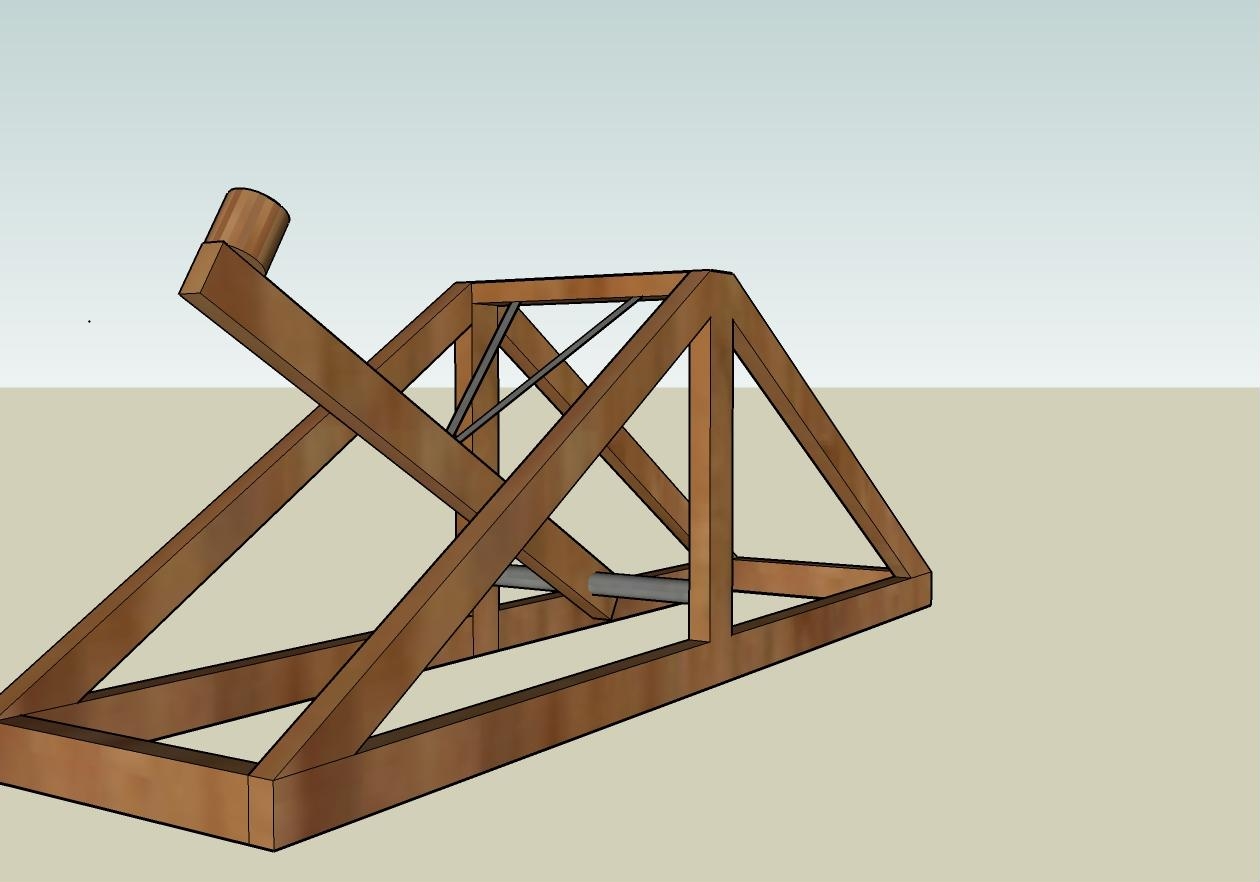
The design we chose, as shown in the above image, allowed us to specifically stop the catapult's throwing arm at different angles by using a quick release mechanism on the back of the weapon. After settling on a design, we drew up the dimensions of the catapult, giving the base a length of 53 inches, which is 4 and a half feet. The reason we made it so big is because we needed a way to make sure that we can pull the throwing arm back to the different angles and fire it at said angles. After 4 hours of building, using 4 different drills, a handful of screwdrivers and lots of twine, we finished the creation of the catapult. The springs that we used were the largest ones we could find, with a 25 lbs. maximum force. This, we reasoned, was plenty of force to launch a tennis ball. After attaching the springs, we loaded it with a standard tennis ball, pulled the arm back to the first trial angle, made sure all of our connections were secure, and then fired. We measured the force that it took to pull the arm back to the specified angle by weighing it down using simple exercise weights. It needed a total of 20 pounds in order to pull the throwing arm back to the full launch angle. This was then converted into kilograms as well as Newtons for our calculations later on. The next step was to fire the catapult. Our first trial was the full launch, which made the launch angle a complete 60 degrees. We fired 6 times, and measured where the ball first hit the ground by marking the spot and measuring it with meter tape. After the first 6 trials, we moved on to the next angle, which was a half draw.
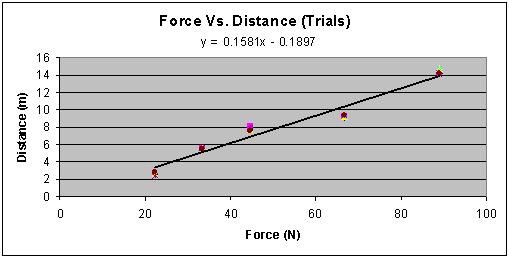
This was our first graph which displayed the relationship between force and distance. The trials didn't really match up with the line of best fit, but they lined up very closely with each other.
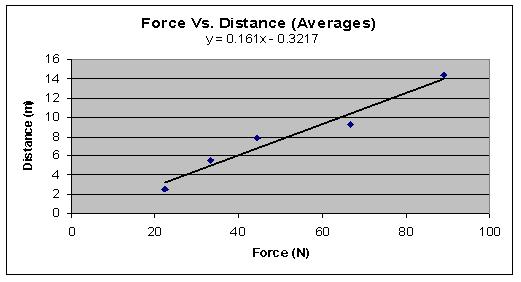
This was our second graph which displayed the relationship between the averages of the trials of the force and distance. Without the other trials to line up against, the line of best fit looks to not fit at all.
Download in .TXT (Tab Delimited)
Download in .XLS (Excel Spreadsheet)
Image One
This is a 3D render of what our catapult was designed to look like. It came out very close.
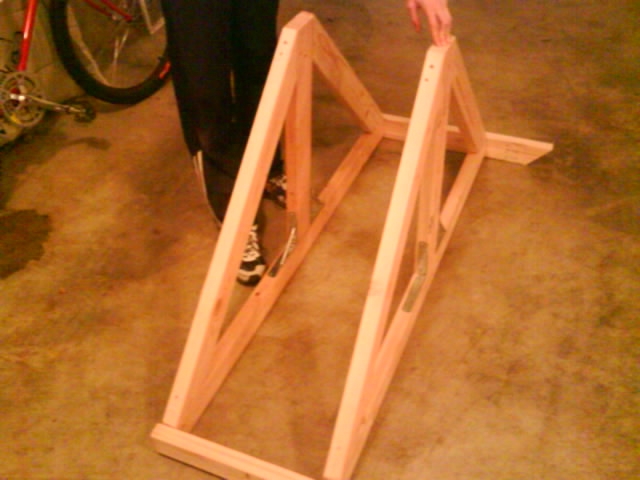
Image Two
This is another image of our catapult as we were still making it.

Image Three
This is an image of the final build of the catapult