The Effect of Air Friction On a Projectile
By Matt Gregson and Matt Losli
Background Info | Statement of Problem | Hypothesis | Variables | Materials | Method | Data Collection | Data Analysis | Evaluation | Bibliography
Projectile motion is the movement of an object upon which the only force acting is gravity. For example: An object dropped from rest, an object thrown vertically upwards, or an object thrown/hit upwards at an angle are all projectiles. Galileo first accurately described projectile motion in that horizontal and vertical motion operated independent of one another. In other words, an object dropped from rest at height h would reach the ground in the same time as an object projected horizontally from that same height h. But many of the conclusions drawn from such suggestions are dependant on one common factor: the absence of air friction. “When air resistance is important, the range is less for a given v0, and the maximum range is obtained at an angle smaller than 45o” (Giancoli 1998). The range referred to in this statement is the horizontal distance a projectile travels from its original position. Normally the maximum range is obtained by launching the object at 45 o with the horizontal. But in real world situations, the trajectory, or path through the air, of a projectile is indeed affected by this air resistance.
The purpose of this experiment is to explore the effect of air resistance on a projectile and to determine how much an actual trajectory deviates from the ideal.
If the projectile (the baseball) is launched at a constant initial velocity but at varying angles, then the resulting range of the projectile will be less than that of the ideal range (found by the range formula) because air friction will have had an effect on the baseball’s movement.
The independent variable will be the angle at which the projectiles are launched from the pitching machine. The dependant variable will be the resulting range (distance) that the baseball lands from the pitching machine.
Pitching machine, baseballs, power source,
extension cord, tape measure, protractor, writing materials,
multiple people to spot the landing
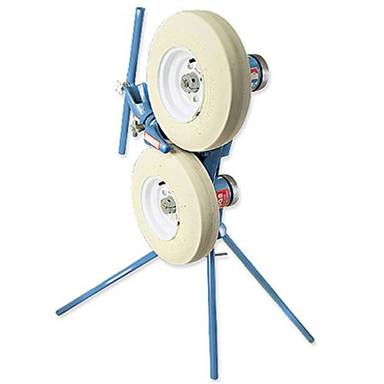
To begin set-up, start by placing the pitching machine in an area with ample space to perform the experiment. For example: a baseball field, football field, or approximately 350 square feet of area. Using the protractor as a guide, tilt the machine so that the trajectory is at an angle of 75 degrees with the horizontal. Next, connect the machine to the power source using the extension cord. Once the machine is on, adjust the velocity knob so that it is set on 60 mph. Allow the machine to warm up, and practice inserting the baseballs so that you are comfortable with the motion. Now it is time to begin trials. There will be four angles used (75, 65, 55, 55) and five trials will be recorded for each angle. Beginning with 75 degrees, launch five baseballs and mark each one as they reach the ground. After that, use the tape measure to record how far away they landed from the pitching machine. Repeat these steps with the machine angled at 65, 55 and 45 degrees. In the end, you should have twenty data points.
On the day of the actual experiment, it was about 38oF with little wind and no precipitation. The ground was somewhat wet from recent rainfall. The surface that the experiment was conducted on was artificial turf. At first, we set the pitching machine to 45mph. We decided to up the velocity to 60mph (26.8 m/s) because we wanted air friction to have a more substantial effect on the baseball’s trip through the air. Marking the exact spot of the landing wasn’t very difficult, as we had someone out in the landing area to see where it hit the turf. The measuring of the actual range was as accurate as possible, yet the tape only went to 100ft. which then forced us to split the distance into two measured sections, thus increasing the uncertainty.
|
75 Degrees |
|
65 Degrees |
|
55 Degrees |
|
45 Degrees |
||||
|
Trial |
Distance (ft) |
|
Trial |
Distance (ft) |
|
Trial |
Distance (ft) |
|
Trial |
Distance (ft) |
|
1 |
100 |
|
1 |
153 |
|
1 |
191.5 |
|
1 |
277 |
|
2 |
94.5 |
|
2 |
149 |
|
2 |
200.5 |
|
2 |
278 |
|
3 |
96 |
|
3 |
154 |
|
3 |
200.5 |
|
3 |
284.5 |
|
4 |
94 |
|
4 |
154 |
|
4 |
204.5 |
|
4 |
286.5 |
|
5 |
107 |
|
5 |
157 |
|
5 |
207.5 |
|
5 |
289 |
|
AVG |
98.3 |
|
AVG |
153.4 |
|
AVG |
200.9 |
|
AVG |
283 |
Converting feet to meters gives us:
|
75 Degrees |
|
65 Degrees |
|
55 Degrees |
|
45 Degrees |
||||
|
Trial |
Distance (m) |
|
Trial |
Distance (m) |
|
Trial |
Distance (m) |
|
Trial |
Distance (m) |
|
1 |
30.48 |
|
1 |
46.6344 |
|
1 |
58.3692 |
|
1 |
84.4296 |
|
2 |
28.8036 |
|
2 |
45.4152 |
|
2 |
61.1124 |
|
2 |
84.7344 |
|
3 |
29.2608 |
|
3 |
46.9392 |
|
3 |
61.1124 |
|
3 |
86.7156 |
|
4 |
28.6512 |
|
4 |
46.9392 |
|
4 |
62.3316 |
|
4 |
87.3252 |
|
5 |
32.6136 |
|
5 |
47.8536 |
|
5 |
63.246 |
|
5 |
88.0872 |
|
AVG |
29.96184 |
|
AVG |
46.75632 |
|
AVG |
61.23432 |
|
AVG |
86.2584 |
 As you can see, the
range of the baseball becomes smaller as the angle of the pitching machine is
tilted more upward. This is, of course, what we expect to happen. Now, the
question is how different are these numbers than the ideal numbers we get from
plugging these values into the Range Formula? (Neglecting Air Friction)
As you can see, the
range of the baseball becomes smaller as the angle of the pitching machine is
tilted more upward. This is, of course, what we expect to happen. Now, the
question is how different are these numbers than the ideal numbers we get from
plugging these values into the Range Formula? (Neglecting Air Friction)

R45 = (26.8224)2 * sin(2*45) / 9.8 = 73.41 m (Less than actual value)
R55 = (26.8224)2 * sin(2*55) / 9.8 = 68.99 m (More than actual value)
R65 = (26.8224)2 * sin(2*65) / 9.8 = 56.24 m (More than actual value)
R75 = (26.8224)2 * sin(2*75) / 9.8 = 36.71 m (More than actual value)
Subtracting the actual values from these ideal values gives us the difference of ranges, which should show how air resistance affected the path of the baseballs.
73.41m (actual) – 86.26m (ideal) = -12.85m
68.99m (actual) – 61.23m (ideal) = 7.76m
56.24m (actual) – 46.76m (ideal) = 9.48m
36.71m (actual) – 29.96m (ideal) = 6.75m
As we compare the ideal range of the projectiles with the actual measured values of the baseball launches, you can see a trend that shows the ideal values to be greater than the real-life demonstrations. This makes sense, because with our experiment, the baseballs were battling against air friction. The projectiles, dealt with in the ideal Range Formula calculations, did not have to take into account this drag force. Also, we had gone into the experiment with the idea that as the angle of trajectory increases, the effect of air friction should then also increase. This would’ve been shown from the difference in range values for each trial. What that would’ve meant is that as the baseballs spent more time in the air, there was then more energy lost to air friction during that time. Our hypothesis, however, was supported for the most part in that the actual ranges were less than the ideal. Yet, our data does not distinctly show a major change in difference in range as the degree of trajectory increases.
As expected, there was sufficient error in the collection of data. This was the result of a few things. Obviously, the velocity knob in the pitching machine may have been off slightly, thus providing a false initial velocity. Also, when measuring the angle of trajectory, the only tool used was a protractor. This method may have been a bit faulty, considering the protractor was being lined up with the horizon line. Next, the pitching machine operated on a ball in socket kind of arrangement. This made it difficult to adjust the machine so that the baseballs would be launched precisely vertical. The outside temperature may have also played a role in the resulting ranges. Also, as we measured the actual ranges, the tape measure only reached 100 ft. This made it difficult in that we had to re-measure from a marked spot on the field, therefore increasing our likelihood for error.
Uncertainty:
?R / r = ?V/v + ?Angle/angle + ?G/g
?R = 46.76*[(2/26.8224) + (5/65) + (.01/9.8)] = +/- 7.13 m
This experiment could be improved in many different ways. There should have been more data points taken in order to provide a better idea of trends and conclusions from the information taken. Also, the use of more exact instruments such as a radar gun, a larger protractor, or perhaps more efficient measuring device.
Carmichael, Ralph. “Numerical Procedure for Computing the Trajectory of a Baseball”. Public Domain Aeronautical Software, Santa Cruz, CA. http://www.pdas.com/bb2.htm
Giancoli, Douglas C., Physics Principles With Applications. Upper Saddle River, New Jersey: Prentice Hall, 1998.
MacInnes, Iain. “Notes on a demonstration of projectile motion.” School Science Review. 87.320 (March 2006): 17-18. Professional Collection. Gale. Tualatin High School. 29 Oct. 2007. http://find.galegroup.com/ips/start.do?prodId=IPS
O'Hanian, H. C. "The Motion of Projectiles." §4.3 in Physics, Vol. 1. New York: W. W.
Norton, pp. 71-76, 1985.
Sarafian, H. "The Magic Angles of Projectile Motion." Mathematics in Educ. Res. 9, 20-
26, 2000.
Related Sites
"Projectile Motion" http://www.regentsprep.org/Regents/physics/phys06/aairproj/default.htm - This page illustrates, in a way that is easy to understand, the basic principles of projectile motion and how air friction affects it.
"Physics of Baseball" http://library.thinkquest.org/11902/physics/air.html - This page discusses the specifics of how a baseball acts as a projectile.
"Air Resistance, Gravity, Range, Trajectory" http://www.physclips.unsw.edu.au/jw/projectiles.htm - This page provides some detailed information and inquiry on projectiles.
"Vertical Trajectory" http://hyperphysics.phy-astr.gsu.edu/hbase/mechanics/quadrag.html - This page provides information on the drag coefficient as well as a vertical trajectory calculator