Wind Tunnel of
DOOOOOOM!
Tom Dement
Jarad vanSchaik
IB Physics II
Period 3A
- Introduction
- Materials Required
- Procedures/Set-up
- Data Analysis/Data/Graphs
- Conclusion/Analysis
- Review of Literature, and Bibliography
- Return to Research
Wind Tunnel
of Doooom Final Paper
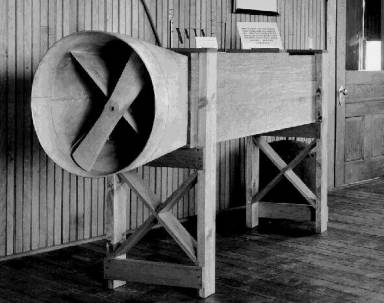
Different objects in our world require different amounts of force to knock them over. Different variables can cause objects to fall either more easily or with more difficulty. For example the weight of an object; two objects with the same size and shape won’t necessarily fall over with the same amount of wind force being applied to them. This is because of weight. For our project we attained a wind tunnel via Mrs. Hubbard and decided we wanted to experiment with the idea of different variables causing a water bottle to get knocked over. We determined the three main factors of an object that would cause them to fall either more easily or with more difficulty were size, shape, and weight.
We chose size because an object with more surface area facing oncoming wind would fall more easily. We actually tested this because we found that the water bottle we were using as an object only wasn’t falling easily enough. To solve this we cut a flat, square piece of cardboard out and attached it to the water bottle. This added a lot of surface area to the water bottle as well making the shape catch wind more easily.
We chose shape because we realized from our own personal experience as well as from our research that an object like a spear is going to cut through wind much easier than an object similar to a parachute. By adding a flat piece of cardboard to our object it added very little mass and added a shape that would cause the wind to hit our object more directly as opposed to just sliding off. This cleverly made device allowed for a broader range in our data points so we would be able to see more trends in our data.
The last factor we chose was weight. This would also be the main variable that we would be testing. We found through our data that an object with more mass will be more difficult to knock over than an object with less mass. This is a fairly simple concept although there are also other factors involved in the weight of an object than just the overall weight. An object with all of its mass at the top of the object is more difficult to knock over than an object with all of its weight at the bottom of the object. However, we decided that it would be too difficult to create a contraption that we could choose where the majority of the mass would be at while still keeping a fairly reliable and accurate experiment.
Back to the table of contents!
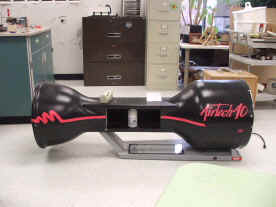
-Wind Tunnel -or- some sort of somewhat reliable and measurable machine that blows wind.
-Ping Pong Ball
-String
-Tape
-Paper
-Water bottle
-Water
-Protractor
-Scissors
-Graduated Cylinders
-Scale
-Pencil
-Piece of cardboard
Back to the table of contents!
- Place wind tunnel in one spot and leave it there for the entire experiment.
- Grab all the required materials and place them in a spot where you can actually find them.
- Attach a pencil
with tape to the floor of the wind tunnel; this will act as a tripping
device for the water bottle so it falls instead of sliding.
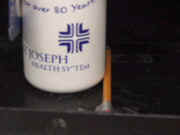
- Attach a flat piece of cardboard to your water bottle with tape.
- Tape a protractor to the ceiling of the wind tunnel with the intention of measuring the angle the string makes because of the wind.
- Tape a piece of string to Ping Pong ball.
- Tape the other end
of the string to the top of the wind tunnel such that it is attached
and hanging freely from the same exact point where the middle of the
protractor is.
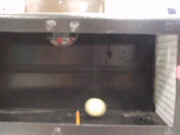
- Tape everything securely because there will be wind (obviously) without effecting the mass of anything.
- Leave the water bottle out of the wind tunnel and turn the wind tunnel on with the Ping Pong ball and protractor attached inside.
- Watch carefully and find what the highest angle the wind gusts the Ping Pong ball to.
- After finding the highest angle that the ball is gusted to take out the Ping Pong Ball.
- Leave the wind tunnel running.
- Place a water bottle
with a certain amount of water such that the water bottle will barely
fall over.
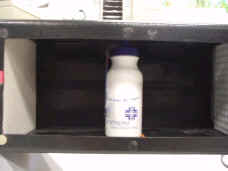
- If the water bottle falls too easily and stands too strongly vary the amount of water in it such that it barely falls.
- Finding the point that it barely falls over and test it two or three times.
- Take the amount of water and pour it into a graduated cylinder to measure the amount of water inside the water bottle.
- Record the amount of water inside the water bottle at the angle the Ping Pong ball was hanging.
- Now, vary the amount of wind being blown through the tunnel.
- Do this by placing a piece of paper on the grate blocking some of the flow of the air.
- Repeat steps 6-16 and keep recording.
- Block either more or less air to vary the angle of the Ping Pong ball until you have 5 different speeds.
- Remember to leave the wind tunnel running once you have a certain speed that you want to maintain, this keeps the paper from moving around that is blocking the speed of the wind tunnel.
- Use the information
on http://www.bom.gov.au/lam
/Students_Teachers/Worksheet16 to calculate the speed of the wind based on the angle of the Ping Pong ball.shtml
Back to the table of contents!
The
mass of our water bottle with the cardboard attached to it had a total
mass of 54g.
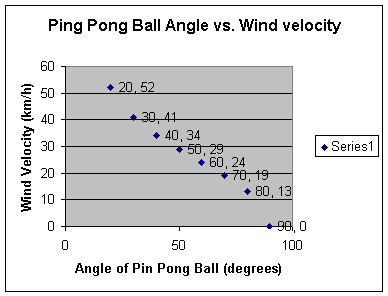
| Angle of Ping Pong Ball(degrees) | Wind Velocity(km/h) |
| 20 | 52 |
| 30 | 41 |
| 40 | 34 |
| 50 | 29 |
| 60 | 24 |
| 70 | 19 |
| 80 | 13 |
| 90 | 0 |
We did some research online
and found a website which allowed us to figure out the speed of the
wind in our wind tunnel and this is just a graph of that information.
The graph looks pretty linear until the final and beginning degrees
where it looks exponential.
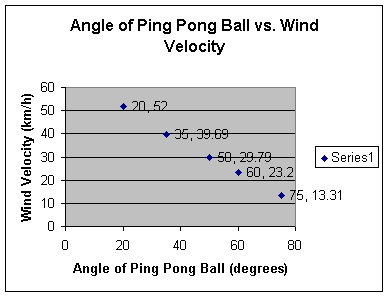
| Angle of Ping Pong Ball(degrees) | Wind Velocity(km/h) |
| 20 | 52 |
| 35 | 39.69 |
| 50 | 29.79 |
| 60 | 23.2 |
| 75 | 13.31 |
Date File2 (Text - tab delimited)
This is a graph of our ping
pong ball angles and the wind velocity that they correlate to.
In order to find the equation to calculate these values we used our
calculator to find the Linear Regression for data we found on the Web.
We calculated the linear regression equation to be y= (-.6595238095)(X)+(62.77380952).
We also calculated the Exponential Regression equation to be y= (81.48269014)+(.9786405012)^X.
However we decided to go with the linear regression equation because
the graph of the internet showed a strong linear correlation. However,
our data for the amount of wind force being applied to the heavier masses
showed a slightly more exponential equation.
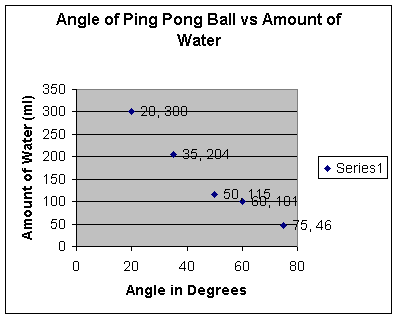
| Angle of Ping Pong Ball(degrees) | Amount of Water(ml) |
| 20 | 300 |
| 35 | 204 |
| 50 | 115 |
| 60 | 101 |
| 75 | 46 |
Data File3 (Text - tab delimited)
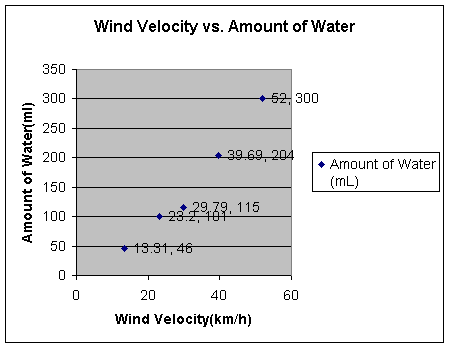
| Wind Velocity(km/h) | Amount of Water (mL) |
| 52 | 300 |
| 39.69 | 204 |
| 29.79 | 115 |
| 23.2 | 101 |
| 13.31 | 46 |
Data File4 (Text - tab delimited)
This graph shows the point
of our entire project which was to find out how little wind as possible
would cause a bottle to fall over. The one problem with this was that
it was harder to control the wind rather than the mass of the bottle
so we kind of did this experiment in reverse order to what we would
have done had we had a very easy to control wind tunnel.
Data Analysis: Basically,
this all means that when you put more liquid into a bottle, the more
wind velocity is needed to knock the bottle over. This is because when
water is added to the bottle; the mass is increased, thus requiring
more wind velocity in order to knock the bottle over. This is because
the center of gravity is where the average mass of the object is and
when you add water to the bottom the mass is greater towards the bottom.
This makes the center of gravity lower, and the lower the center of
gravity, the more wind velocity is required to knock over the object.
Back to the table of contents!
In our experiment, we learned more about the scientific process rather than making miraculous discoveries within our specific experiment. We learned about the difficulties of creating a reliable and stable experiment and how hard it is to keep everything the same. We took many precautions to keeping the experiment stables such as leaving the wind tunnel running for extended amounts of time to keep the paper (which was blocking the flow of air) in the exact same place so that the speed wouldn’t vary. As soon as we determined the speed of the wind from the angle of the Ping Pong ball we had to keep everything the same. We had to place the water bottle at the same spot the Ping Pong ball was hanging at so the speed acting on the ball and the bottle would be the same. We could have changed how we dealt with the weight in our experiment slightly by adding more variables to the weight such as where the weight will be located within the water bottle. This would have been very hard to analyze and actually do as well. However we would have like to have evenly dispersed weight throughout the object as we believe that would have made for a more reliable weight. However, with gravity and water as our source of weight this would have been nearly impossible without varying the size of the water bottle.
Throughout our experiment we felt our data was pretty accurate however we will never really know whether the wind tunnel stayed as consistent as we would have liked. With random gusts here and there and other outside factors causing slight inaccuracies some of our points could be totally off and there really isn’t a great way for us to find out whether they were or not. By leaving the wind tunnel on for so long we’re fairly certain that the speed may have changed once or twice but hopefully not. At 24 km/hr (60 degrees) our point doesn’t really match up with our graphs very well. We’re unsure of what may have caused this but it is probably some sort of human error or possibly the machine just isn’t as consistent as we need.
We also found that our hands releasing from the water bottle would sometimes cause a jump in the amount of force being applied to the water bottle, causing more inaccuracies at times. We had to be very careful with how we released the bottle from our hands so that it would be standing on its own. We could not place the water bottle inside the tunnel before turning it on because this would cause the paper that was blocking some of the air flow to move. This made the project somewhat difficult but we found if we just had one finger holding it up and letting go quickly we could have as minimal of an effect on the bottle and airflow as necessary. Throughout our data we spent time discussing whether or not our data was linear or exponential. We thought that it must be somewhat exponential at least based on the Ping Pong ball method of measuring the wind speed. Once the ball is parallel with the wind tunnel (a zero degree angle) we really don’t know how fast the ball is traveling. It could be going anywhere from 81.48 degrees (assuming it is in fact an exponential equation) to infinite. The ball has reached its maximum potential by going that speed which is why we avoided measuring it. We tried to stay between 20 degrees and 80 degrees because it’s simply easier to measure and calculate. Most of the data we did find appeared to be somewhat exponential but not very obviously.
We also decided that the bigger everything is, the easier it would have been to do our experiment. The longer the string attached to the Ping Pong ball the more stables the string would have been. The bigger the protractor is, the easier it is to read the angle. However, because of the size of the wind tunnel we had to make everything smaller and a little more difficult to measure.
