A collection of Data and Analysis compiled by Jason Sandvik and Kyle Johnson
Table of Contents
Introduction Problem Review of Literature Hypothesis Variables Bibliography Method Discussion Related Sites
Introduction
The all important “sweet spot.” The perfect strike of the ball for the golfer, or baseball player, that is confirmed with a satisfying “thwack”. In golf, the sweet spot, or ideal spot of contact, is generally the middle of the head of the club. The golfer generally has a good idea of where the ball is going when he hits the sweet spot because it tracks the path that it is originally intended to follow. Take for example, putting. A chief component to putting is “consistently making contact in the center of your
putter face. Contact out toward the toe or heel results in far less energy transfer, which means different results from the same stroke” (Nilsson, 2006). The sweet spot is important in all sports, but perhaps is most important in golf, if contact with the ball is inaccurate, and the ball is struck with great force, then the path of the ball will be highly imprecise.
Problem
The purpose of this experiment is to test different points of contact on a putter with a golf ball hit with equal force and find the trajectories of each.
Review of Literature
Our literature will focus on the possible discrepancies that could occur from hitting a ball away from the ideal location with a putter. For example, one putter designer, knowing that the ideal location for properly striking the ball was the center point of the club, decided to raise the center of mass in the club. He did this because, “If you raise the center of mass, you will increase the
tensional forces” (Rogers, 2000). In short, he knew by adding weight to the center, he was more likely to strike with the sweet spot providing him with the best possible shot. In other studies it has been noted that “misbalanced putters have resulted in an disproportional amount of balls being hit of the head and heel of the club resulting in many errant strokes” (Golf Digest, 2002). This piece of information tells us that when balls are not struck in the ideal location of a golf club, their path is unsatisfying to the golfer. Also, “misstriking results in lower force, explaining why a ball can roll past a hole on putt, and shoot past it the next” (Callaway Golf, 1998). This tells us that not only does contact outside the ideal location result in a wayward path, but can also affect the distance traveled by the ball. Lastly, “with a consistent stroke, a ball will follow the intended path of the golfer relying on the playing surface in front of them” (Nike Golf, 2004). This information tells us all that we need to know. The sweet spot provides consistency, while the heel and toe of the club will provide varying, errant distances and courses.
Hypothesis
We believe that our results will be consistent when the ball is struck on the sweet spot, and that when the ball is hit on the extreme edge of each end of the club the angle from the original spot and distance traveled will vary greatly. This is because the center of mass and inertia is in the middle of the head of the club, and the outer edges are out of balance in relation to the ball. We will try to find the “sweet spot”, or where the most consistent results occur. Consistent is the smallest range of distances. Range is the difference between the largest and smallest distances from a trial. Sweet spot is center of mass of the club. Heel of club is edge closest to the shaft. Toe of club is the edge farthest from the shaft.
Variables
The length that the club is pulled back (back swing)-15.24 cm, 22.86 cm, 30.48 cm
The spot on the club where the ball was hit (heel, mid heel, center, mid toe, toe)(see
Putter Markings)
Bibliography
Calloway Golf. The mispower of Imbalance. Calloway Tips page.
1998 Http://Callowaygolf.com/tips/putting/ar243
Golf Digest. The Centerpiece of your Putting. Golf Digest, New York 2002.
Nike Golf. A New Force in Golf. Nike Products>Golf>Putters
2004. www.nikegolf.com/products/putters/readmore
Nilsson, Pia. Feel Your Way to Better Putting. Golf Magazine, Nov. 2006.
Rogers, Michael. Putter with a Purpose. Caltech News page.
2000 Http://pr.caltech.edu/periodicals/caltechnews/articles/v39
Method
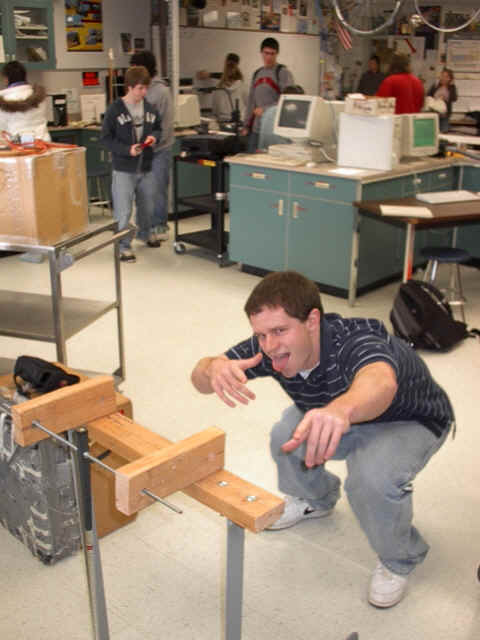
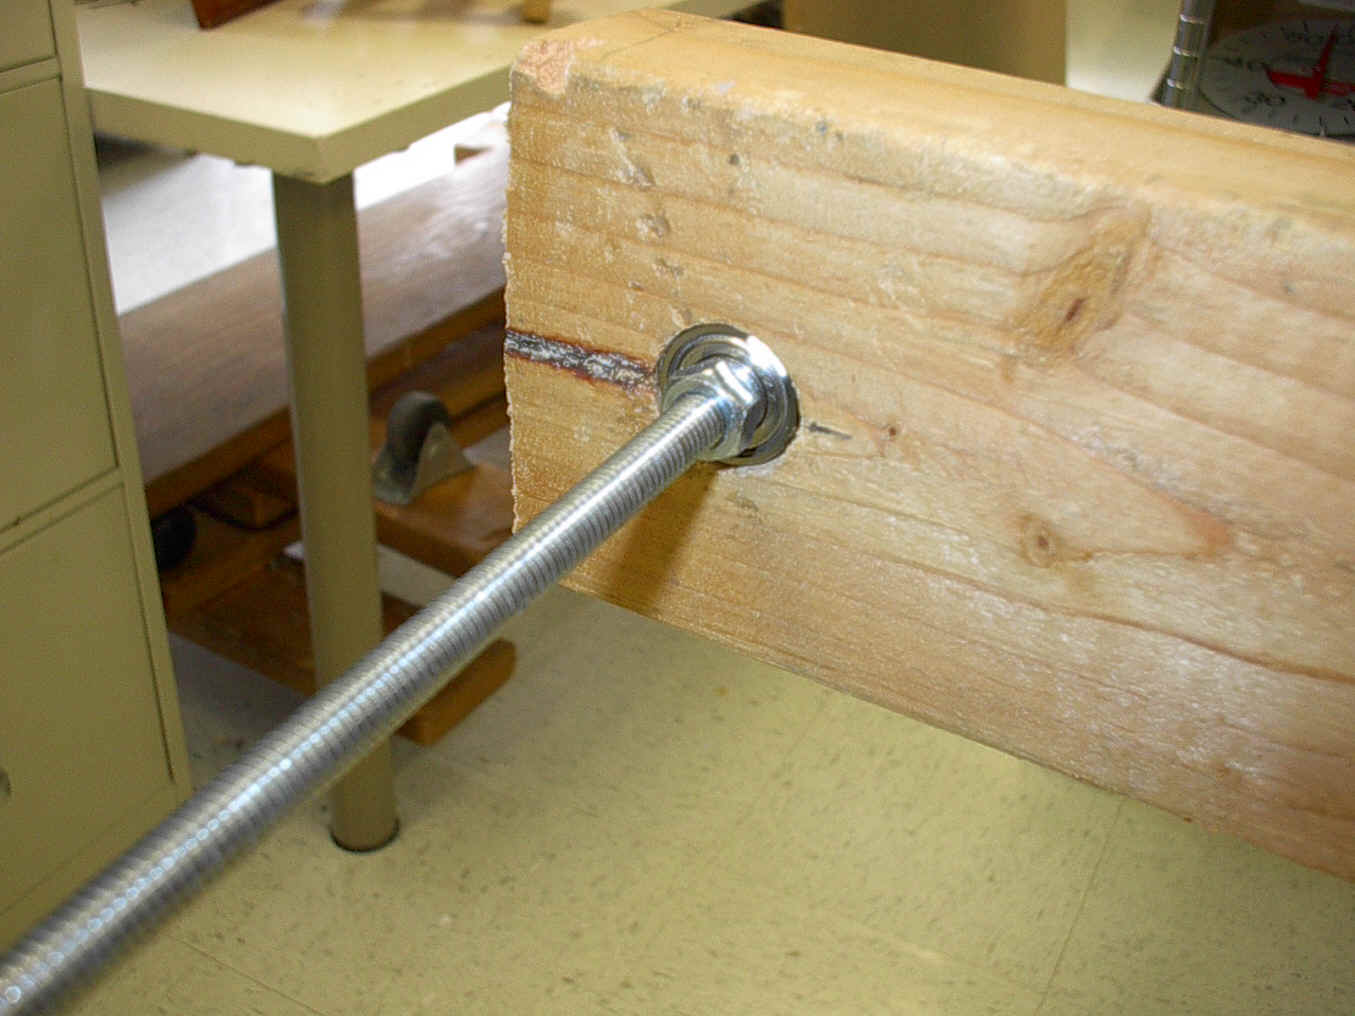
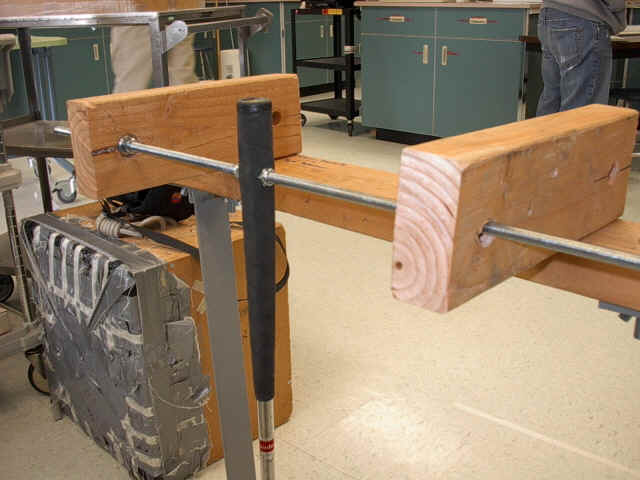
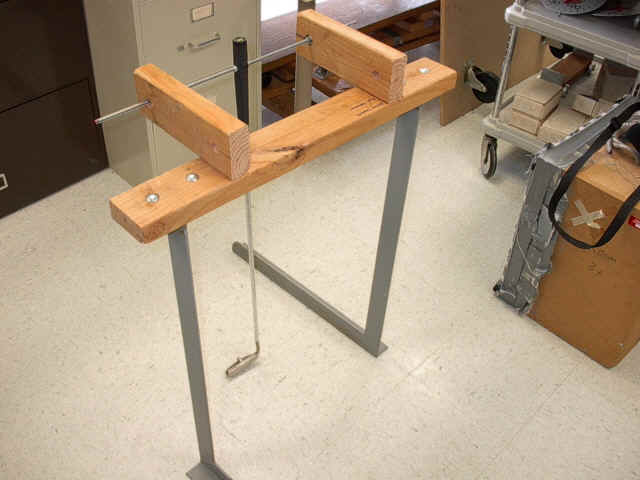
In order to successfully set up our experiment, we needed a number of constants. First, it is implausible to have a person swing the club because no two swings are ever scientifically the same. A person swinging the club would produce multiple angles and forces on the ball, which would decrease the accuracy of our data. Therefore, we made a putting apparatus
(picture 1), designed so that we would be able to create a constant swing that would minimize any error. The putting apparatus was constructed of wood and made to stabilize the putter throughout the
back swing and swing. A wide base was used to provide the apparatus with a good center of balance. The putter itself had a hole drilled into it on the grip, with a steel rod placed through it. The steel rod ball bearings placed either end, which provided us with a smooth, steady, constant swing.
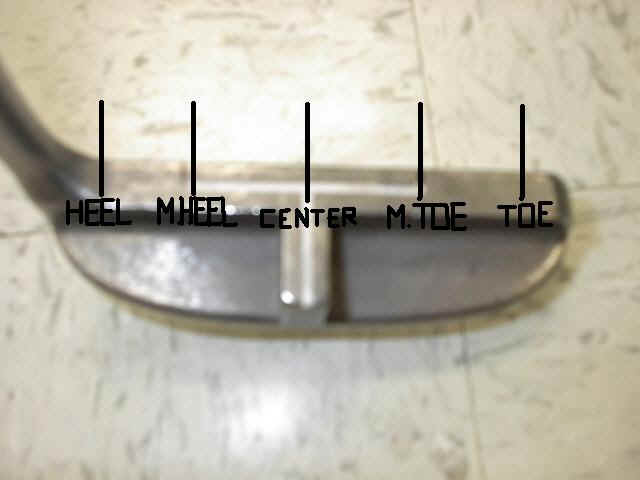
On the putter itself we marked various spots on the club to denote heel, mid heel, center, mid toe, and toe
(picture 2). By doing this, we assured that all of the measurements taken when the ball was hit from these spots were precise. As well, we used the same ball for every trial to ensure that our results were consistent.
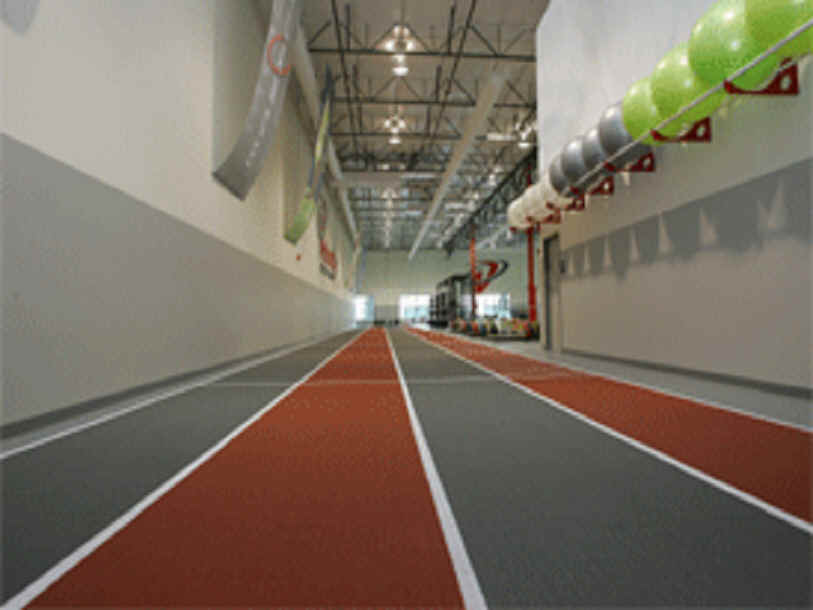
Next, we found a surface that provided us with both a fast and consistent surface to help diminish error. We went to Velocity Sports Performance, and used the astro turf,
(picture 3) a synthetic carpet like field, in order to make certain that our data was trustworthy.
The actual testing involved us hitting the ball with varying amount of force from different points on the clubface. We did nine trials from each point on the putter (toe, mid toe, center, mid heel, heel). Within these nine trials, we tested three different
back swing lengths (15.24 cm, 22.86 cm, 30.48 cm). For every spot on the putter, nine trials took place, and for these nine trials, there were three varying distances tested.
(Data Table/Graph of
Distances)
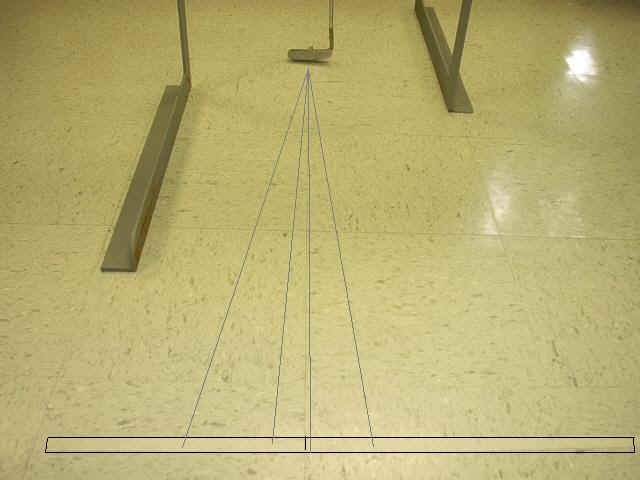
Since we were measuring both the total length, and the angle off of the putter face from various spots on the club, we placed a long strip of tape
(picture 4) exactly one meter in front of the apparatus and marked the point at which the ball passed over it. We marked which the amount of centimeters we pulled back, the location from which we were striking and the trial number on the tape. As well, we placed a line on the tape directly in front of the putter so that we could measure the difference from the center in relation to the location of where the balls from the trials had passed over. In other words, we would later measure from the center, to where one of our trials had passed over in order to get the distance, which would help us find the angle at which the ball was hit.
(Data Table/Graph of Angles)
As well, since we were measuring the total displacement of the putts, we measured the ball’s final location with a measuring tape, stretching from the balls resting place back to the location of the putter.
In order to measure the angles, we used the inverse tangent function and divided our horizontal displacement (the measurement on tape from center to point where ball passed over) by 100 cm. We used 100 cm because this is how far the strip of tape was placed in front of the putting apparatus. We used this formula because we were trying to find the angle at that the ball made in relationship with the putter, and because we knew the length of both the opposite and adjacent sides, the inverse tangent function was the proper mathematical formula.
Mathematically this is (Tan-1(horizontal displacement/100 cm). This allowed us
to find the deviation of the ball off the, what would be, straight line. (Data
Table/Graph of Deviations)
Distance from rest position - Data File (Text - tab delimited)
|
15.24
cm |
Center |
Mid-Toe |
Toe |
Mid-Heel |
Heel |
|
Trial
1 |
135 |
118 |
127 |
127 |
108 |
|
Trial
2 |
123 |
108 |
78 |
145 |
112 |
|
Trial
3 |
131 |
126 |
106 |
130 |
106 |
|
Average |
129.6667 |
117.3333 |
103.6667 |
134 |
108.6667 |
|
|
|
|
|
|
|
|
22.86
cm |
Center |
Mid-Toe |
Toe |
Mid-Heel |
Heel |
|
Trial
1 |
235.5 |
229 |
143.5 |
236 |
158 |
|
Trial
2 |
263.5 |
208 |
125 |
217 |
143 |
|
Trial
3 |
244 |
218 |
149 |
221 |
190 |
|
Average |
247.6667 |
218.3333 |
139.1667 |
224.6667 |
163.6667 |
|
|
|
|
|
|
|
|
30.48
cm |
Center |
Mid-Toe |
Toe |
Mid-Heel |
Heel |
|
Trial
1 |
374 |
352 |
195 |
373 |
231 |
|
Trial
2 |
371 |
335 |
182 |
335 |
254 |
|
Trial
3 |
381 |
348 |
159 |
358 |
219 |
|
Average |
375.3333 |
345 |
178.6667 |
355.3333 |
234.6667 |
Distances/Deviations in Centimeters- Data File (text- tab delimited)
| Center | Deviation | Distance | Toe | Deviation | Distance | Heel | Deviation | Distance | ||
| 15.24 (1) | 0.945 | 135 | 15.24 (1) | 8.128 | 127 | 15.24 (1) | -1.512 | 108 | ||
| 15.24 (2) | 0.492 | 123 | 15.24 (2) | 10.686 | 78 | 15.24 (2) | -6.16 | 112 | ||
| 15.24 (3) | 4.585 | 131 | 15.24 (3) | 8.162 | 106 | 15.24 (3) | -4.982 | 106 | ||
| 22.86 (1) | 12.9525 | 235.5 | 22.86 (1) | 14.2065 | 143.5 | 22.86 (1) | -11.06 | 158 | ||
| 22.86 (2) | 11.8575 | 263.5 | 22.86 (2) | 10.5 | 125 | 22.86 (2) | -3.146 | 143 | ||
| 22.86 (3) | 7.808 | 244 | 22.86 (3) | 15.496 | 149 | 22.86 (3) | -2.66 | 190 | ||
| 30.48 (1) | 15.708 | 374 | 30.48 (1) | 15.015 | 195 | 30.48 (1) | -5.082 | 231 | ||
| 30.48 (2) | 18.921 | 371 | 30.48 (2) | 14.742 | 182 | 30.48 (2) | -10.414 | 254 | ||
| 30.48 (3) | 18.016 | 375.3333 | 30.48 (3) | 13.992 | 159 | 30.48 (3) | -8.103 | 219 | ||
| Mid Toe | Deviation | Distance | Mid Heel | Deviation | Distance | |||||
| 15.24 (1) | 3.776 | 118 | 15.24 (1) | 1.651 | 127 | |||||
| 15.24 (2) | 8.856 | 108 | 15.24 (2) | -1.595 | 145 | |||||
| 15.24 (3) | 4.662 | 126 | 15.24 (3) | 3.64 | 130 | |||||
| 22.86 (1) | 13.053 | 229 | 22.86 (1) | -1.888 | 236 | |||||
| 22.86 (2) | 13.312 | 208 | 22.86 (2) | 1.302 | 217 | |||||
| 22.86 (3) | 11.99 | 218 | 22.86 (3) | 3.536 | 221 | |||||
| 30.48 (1) | 19.712 | 352 | 30.48 (1) | -5.222 | 373 | |||||
| 30.48 (2) | 11.122 | 335 | 30.48 (2) | 0.335 | 335 | |||||
| 30.48 (3) | 14.5464 | 348 | 30.48 (3) | -0.358 | 358 |
Degrees off straight line after initial contact- Data File (text- tab delimited)
|
15.24
cm |
Center |
Mid-Toe |
Toe |
Mid-Heel |
Heel |
|
Trial
1 |
0.4 |
1.83 |
3.66 |
0.75 |
0.8 |
|
Trial
2 |
0.23 |
4.69 |
7.8 |
0.63 |
3.15 |
|
Trial
3 |
2 |
2.12 |
4.4 |
1.6 |
2.69 |
|
Average |
0.876667 |
2.88 |
5.286667 |
0.993333 |
2.213333 |
|
|
|
|
|
|
|
|
22.86
cm |
Center |
Mid-Toe |
Toe |
Mid-Heel |
Heel |
|
Trial
1 |
3.1 |
3.26 |
5.65 |
0.46 |
1.26 |
|
Trial
2 |
2.58 |
3.66 |
4.8 |
0.34 |
2.35 |
|
Trial
3 |
1.83 |
3.15 |
5.94 |
0.92 |
2.12 |
|
Average |
2.503333 |
3.356667 |
5.463333 |
0.573333 |
1.91 |
|
|
|
|
|
|
|
|
30.48
cm |
Center |
Mid-Toe |
Toe |
Mid-Heel |
Heel |
|
Trial
1 |
2.41 |
3.2 |
4.4 |
0.8 |
1.26 |
|
Trial
2 |
2.92 |
3.32 |
4.63 |
0.06 |
2.35 |
|
Trial
3 |
2.75 |
4.18 |
5.03 |
0.06 |
2.12 |
|
Average |
2.693333 |
3.566667 |
4.686667 |
0.306667 |
1.91 |

Discussion
The purpose of our experiment was to determine the points on a club that would result in the most accurate strike. We predicted that the center of the club would produce the most solid contact, and therefore would result in the greatest distance with the least amount of horizontal displacement.
We found that the center produced the greatest average distance for each varying
back swing except for one. The shortest back swing, (15.24 cm) resulted in the mid heel producing the greatest average distance of 134 cm per swing. This could be a result of putter design creating a balance that may make up for human error in real life situations when putting. The center, right in line with our hypothesis, generally produced the most consistent displacement. To support this, the center had the smallest range of distance traveled, meaning that the variance was very small compared with other locations.
(Graph of Average Distances)
As well, the heel and mid heel produced much more solid distance numbers than the mid toe and toe. This maybe because there is more mass in the heel and the heel appears to be much more forgiving. The toe also has considerably less mass, and is farther from the shaft which may affect the amount of force during the contact with the ball.
For the angle, the mid heel, on the second largest and largest distances, against our hypothesis, created the smallest angle off the putter. Its average was significantly smaller than the center. An interesting fact is that the center produced the smallest angle of center for the smallest
back swing, but in the second and third largest back swings, it was not even the second smallest angle. The heel, and mid heel were consistently the smallest angle for the larger two
back swings. This might be a result that our putter may have been slightly off center because theoretically a ball hit in the center of the club should produce a straight shot. As well, the surface may have played a part in the variance, although such a consistent problem is probably attributed to the putter.
We found that as a result of our experiment that the sweet spot is probably between the mid heel and center, but closer to the mid heel. The mid heel generally produced the smallest deviation from center, and its distance, while not equal, was the most similar to the center. This combination in both factors gives us reason to believe that the exact center of a putter is not the sweet spot, but rather, a happy medium between center and mid
heel. If we were to repeat this experiment we would probably find the most level surface, possibly a putting green to repeat the procedure. As well, for our putting apparatus, we may find the way we could simulate the angle at which a putter is held, and adjust that. I think our measurement methods were efficient, and we would repeat these. However, despite our findings, if we were to repeat this experiment and make these adjustments, we think we would find that the center would produce the most accurate results.
Puttlighsout.com This site provides tips to improve ones putting, including the tip of how important it is to strike the ball off the center of the putter face when putting.
Odysseygolf.com This link leads to an instructional video that stresses the importance of making solid contact off the center of the putter face.
Drputt.com Here is a step by step guide to executed that perfect putt. These steps include striking the ball off the center of the putter face.
Thesportsshq.com This site provides its readers with drills that help golfers putt off the center of the putter face.
Golfasian.com This link is extremely beneficial for helping those in the Asian community properly strike the ball of the center of the putter face.
Thegolfchannel.com This links you to a putting tip from David Leadbetter, one of golf's top instructors. He references squaring up the putter face to make solid and constant contact.
Pelzgolf.com This site shows a product, produced by Dave Pelz, that trains a player to hit the ball off the center of the putter face.
Pictures
Back to Method Back to Variables