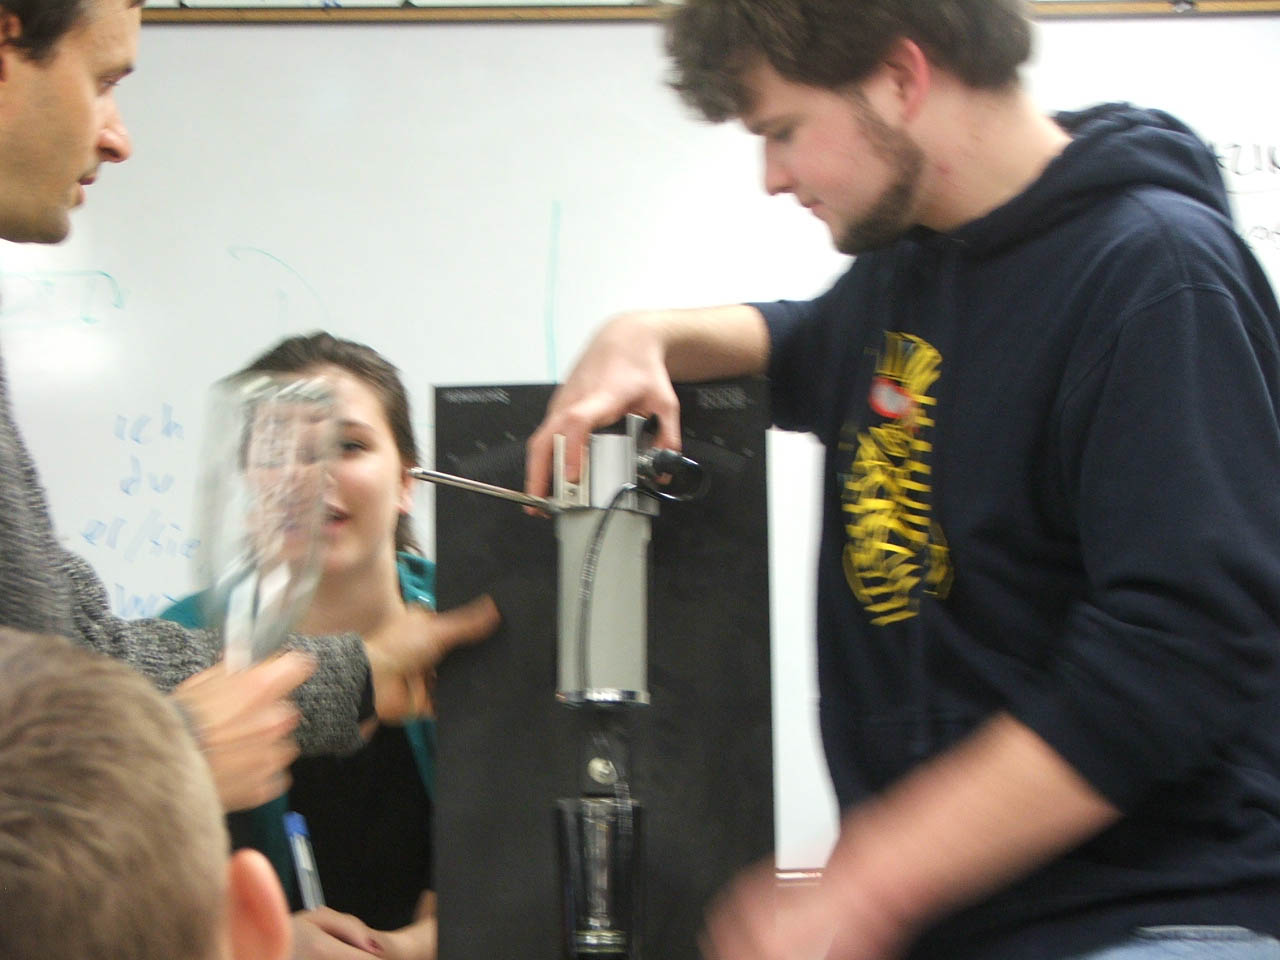
Set-up Diagram
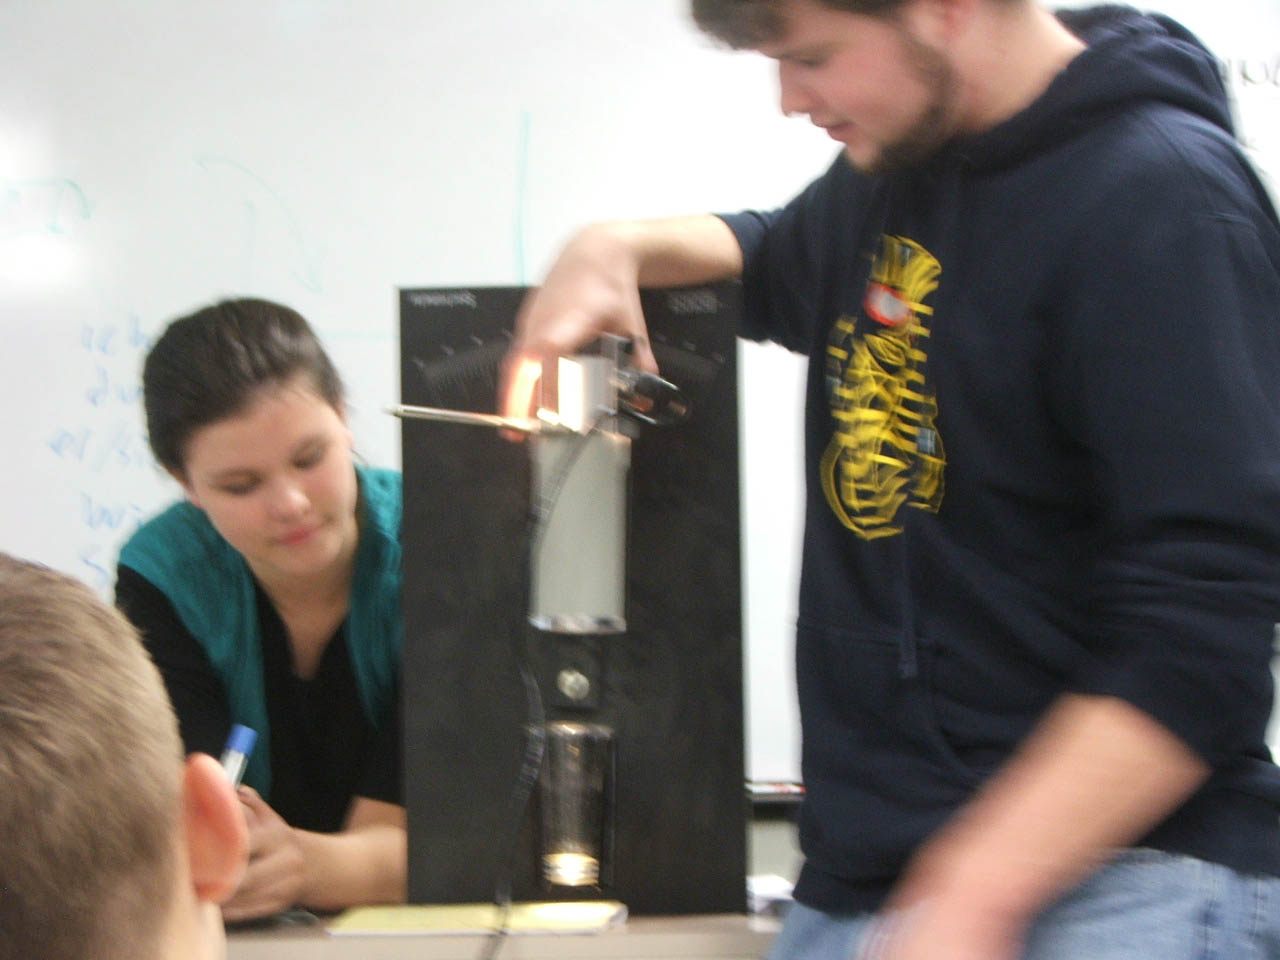
Will and I working on strenuous labor to construct our amazing physics project
“S’milk on the Water”
Penetration of Light Through Water and Milk
By Lacey Bruske, and Will Lambeth
Period: 4A
Table Of Contents
Table of Contents | Introduction | Hypothesis
| Graphs | Materials | Procedure
| Analysis/Conclusion
Bibliography | Return to Research
Introduction
Review of Literature
Our experiment is based more on how light is refracted through a liquid
substance. We must understand the way in which light reacts, and how to measure
such a substance. In the basic Light Volume 1, it described light “consisting
of individual particles which are emitted by light sources and which propagate
through space in straight lines.” Better helping us understand that as the
light is emitted through our source its Manipulating Light gives an in depth
approach to how light is absorbed by substances, especially a liquid, such as
milk and describes the process in which this occurs. In Photonic Crystals and
Light Localization they cite that “the light localization of transmitted
intensity with distance, is the absorption by the substance of the light.” Our
light has to not only pass through water, which is in fact tap water, but also
the milky substance, significantly reducing how many photons will pass through.
We would use the science encyclopedia to cite in our main write up for basic
definitions, and formulas when we discuss the speed at which light passes
through a liquid, such as milk and water. The article in Science in the Making
describes the way the beams penetrate substances, and are able to be identified.
The internet site listed below was helpful in introducing new measurements and
techniques on how to measure light, and the velocity of it once it has reached
the liquid. It also gave a brief description of how to measure lost light due to
absorption into the liquid.
Description of the Question
What effect will adding milk to a container of water have on the opacity of the
solution, both when tested from straight on and from the side?
Independent variables: the ratio of milk to water in the solution, the angle at
which the light hits the water
Dependent variable: the intensity (in lumens) of the light recorded on the other
side of the solution by a sensor.
Back to Table of Contents
Hypothesis
We believe that if we shine a light at varying angles through a bottle
containing varying amounts of milk, the amount of light picked up by a sensor on
the other side of the bottle will decrease proportionally to the milk added when
tested straight on because it will cloud the solution, but increase
proportionally when tested from the side because the milk will refract more
light to the sides.
Back to Table of Contents
Set-up Diagram
Will and I working on strenuous labor to construct our amazing physics project
My head is covered in glass!
Graphs
Materials
• 500 mL of Milk (There will be some extra)
• 600 mL of Water, preferably purified, otherwise tap water works
• A glass, a bottle worked best for the experiment we performed
• In order to replicate our experiment, you will need the apparatus we used,
which guided the angles, as well as set up how our light fit to shine through
our glass bottle.
• A light source with light powerful enough to get a reading
• Measurement in light, in our case we used photons and lumen.
• The measurement was also connected to the computer which read how many lux,
then converted to lumen were being read.
• Beaker, measuring water and milk put into the bottle
• Paper, and pencil to record data
Table of Contents
Procedure
1. Set-up Apparatus, by installing the light fixture, as well as the bottle.
2. Cover sections with black paper so no apparent light can seep out.
3. Attach light sensor to computer for accurate readings.
4. Fill bottle to a tall enough point as is detected by the sensor (200 mL).
5. Set the lux recorder at the end of the apparatus to read the lux.
6. Record the number of lux or lumen detected with just water.
7. Prepare to pour milk in smaller increments, of about 10 mL and measure each
time a new amount is poured in.
8. Shift the apparatus to a ten degree angle, and then read the sensor.
9. There will be times of trial and error, as we had in our experiment, in which
case you must pour out all of the combined liquids and rinse.
10. Repeat steps 3 thru 6 until the sensor no longer records any increments
lower that can be detected.
11. Record all of the data in order to compile an accurate graph.
12. Dismantle the apparatus, and clean out any area that has been contaminated
by the milk, as it may contain an odor after use.
Analysis/Conclusion
Neither part of our hypothesis was supported by our data. Our first contention,
that the milk would cause a decrease in the lumens detected when viewed straight
on, seems to have been disproven, as our data shows a jump when small amounts of
milk are added in the 0-degree category as well as the 5-degree category. The
second part, that the intensity would increase as viewed from an angle, was also
disproven, as after an initial jump the intensity in all three test categories
fell as the milk concentration rose (the 10-degree category never even showed an
initial jump).
The initial jump is by far the most interesting part of the data we collected.
It seems to suggest that there is some refraction effect, and it's possible that
the increments of concentration and angles we were using were simply too large
to catch this effect in detail before the solution became overly clouded and
overwhelmed any possible refraction. With smaller adjustments to the independent
variables, it's possible that this experiment could be performed again and
produce results fully in support of our hypothesis.
However, it's also possible that this was simply an anomaly, and the intensity
will simply decrease as the solution becomes opaque. There are many sources for
possible error: outside light leaking in to the sensor, the milk settling as the
experiment progressed, and the temperature of the solution may all have impacted
the data. The milk had also begun to curdle. Finally, our data suggests that all
of the trials taper towards an intensity of 188 lumens as the concentration
increases. While it is possible that this is simply due to the solution assuming
the opacity of pure milk, it appeared to us that the light sensor we were using
had a threshold at 188 lumens, and could detect nothing less intense than that.
We believe that with a more accurate sensor, the data would continue to vary for
each angle of measurement as the concentration approached 15%.
So, the experiment could be regarded as something of a failure, as the data
managed to apparently disprove both of the contrasting portions of our
hypothesis. The interesting spike in intensity we detected in both the 0- and
5-degree trials, however, leads us to think that more trials might result in a
more favorable result for us. Though we did fail this time, with more equipment
and a finer range of measurement it's very possible that our hypothesis will be
vindicated.
Bibliography
Davis, Edward A. Science in the Making. Taylor and Frances Inc.
Bristol, PA. 1997.
Haken, H. Light Volume 1. North-Holland Publishing Company. Amsterdam. 1981.
Service, Robert F. http://www.sciencemag.org/cgi/content/summary/292/5518/825a
2001, May 4. Vol. 292. no. 5518, pp. 825 - 826
Soukoulis, Costas M. Photonic Crystals and Light Localization in the 21st
Century. Kluwer Academic Publishers. Dordrecht. 2001.
Darlene L. Manipulating Light: Reflection, Refraction And Absorption.
Random House. 1987.
Back to Table of Contents
Related Links
This site discussed how light diffusion functions and its relation to global warming.
This corporation is dedicated to finding consumer uses for light scattering.
This site explains how "dynamic" light scattering occurs when using a medium with small particles.
This explains the mathematical equations that describe light scattering.
This site explains light scattering (particularly "Rayleigh scattering") as found in nature.