Electric currents are used in almost all of current technology, from flashlights and toy cars to supercomputers and “atom smashers”. Due to the power and practicality of electricity, many different types of generators have been used to produce charge or current. Physicist Robert Van de Graaff designed one such device, the Van de Graaff generator, in 1929. This generator was originally used as a power source for early particle accelerators; it uses high-voltage charge to accelerate particles to the extremely high velocities necessary for particle bombardment. In 1929 Van de Graaff “constructed the first working model of his electrostatic accelerator which developed 80,000 volts” (Katz). Van de Graaff’s generator uses extremely high electric potential to continuously store charge on a steel sphere. The machine is a powerful but compact generator, which is often used in classrooms for physics demonstrations—including a phenomenon known as “electric wind”, observed when a pointed conductor is placed on the sphere. Sharp edges concentrate the electric field, making it powerful enough to actually ionize the air- like charges repel each other, so charged air particles will be repelled from the point and create a tiny breeze. Electric wind can bend candle flames, power small motors, and charge nearby objects.
The purpose of this experiment is to determine the relationship between the strength of the ‘electric wind’ created by a Van de Graaff generator and the angle from the direction of the needle.
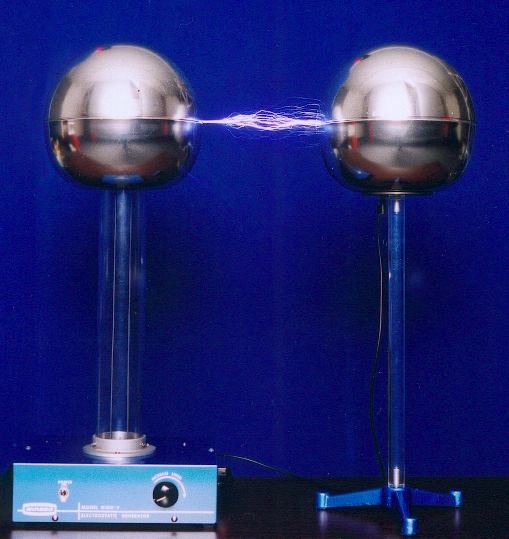
The Van de Graaff machine is an electrostatic generator that has the ‘potential’ to produce extremely high voltages (Katz). The machine produces “static charge”, or high-voltage charge with a constant current. This means that the generator’s voltage varies when drained rather than the current (grounding a Van de Graaff generator would reduce the voltage but not the current) (Zavisa). A belt (generally made of rubber) connects two combs made of special material. One of these combs (at the bottom) pulls electrons from the belt and eventually ionizes the air around itself, repelling free electrons and “coating” the belt with positive ions. The positive charge is pulled from the belt by the top comb and transferred to the outside of a metal collecting sphere. Since the collection of charge is continuous, the amount of charge the machine is capable of storage in this way is enormous (Bram 404-405). Due to the high amount of charge stored on the sphere, a needle or other pointed, conducting object attached to the sphere (pointed objects increase the strength of the electric field) will create an “electric wind”, or a spray of negatively charged electrons (Mitchell). This “electric wind” can bend candle flames and charge nearby objects. Electric fields very with distance, however, and the amount of charge collected varies with time; therefore it is necessary to keep the distance from the generator and the time collecting electrons (ungrounded) constant (Bondar).
I believe that electrons sprayed from a needle attached to a Van de Graaff generator will spray outward in a cone-- represented graphically as angle vs. charge strength at a set distance, the result will resemble a curve which drops to zero at 90 degrees offset. Angle is defined as the change in angle from the direct path of the needle, and charge strength is defined as a measurement of the number of charged particles collected in a certain amount of time. Therefore, what is being tested is actually the rate at which charge is collected, but the experiment will refer to the total charge collected in the set time. It is probable that the shape of the needle or wire used will affect the focus of the spray; flat-ended wires and needles will both be tested to determine which generates a more focused beam.

| Offset Angle | Safety Pin Reading | Paper Clip Reading |
|---|---|---|
| 90 | 0.2 | 0.6 |
| 85 | 0.4 | 0.8 |
| 80 | 0.8 | 1 |
| 75 | 0.9 | 1.1 |
| 70 | 1 | 1.4 |
| 65 | 1.2 | 1.7 |
| 60 | 1.5 | 1.9 |
| 55 | 1.7 | 2 |
| 50 | 1.8 | 2 |
| 45 | 1.9 | 2.2 |
| 40 | 2 | 2.3 |
| 35 | 2.1 | 2.5 |
| 30 | 2.4 | 2.6 |
| 25 | 2.5 | 2.8 |
| 20 | 2.9 | 3 |
| 15 | 3.1 | 3 |
| 10 | 3.2 | 3.1 |
| 5 | 3.4 | 3.2 |
| 0 | 3.4 | 3.2 |
You can find a text file of the raw data here.
The uncertainty in my reading of time was fairly small, considering my use of a watch- I would consider it to be ±.1 seconds, which does not affect the data significantly (except at the highest readings, and even then the difference would be small.) The uncertainty of the electroscope reading, however, is fairly high, due to the motion of the needle and human error. I found the uncertainty to be ±.2 units. This high level of uncertainty does not throw the accuracy of my hypothesis into question, considering the spread of the results; however, this uncertainty does introduce the possibility that the differences in the graphs of the two types of needle are trivial. I do not believe this to be the case, as the two spreads of data are consistent in their differences.
The data I received generally supports my hypothesis, showing that the spray of charged particles is neither a tightly focused beam nor a true cloud. The data suggests that particles are sprayed outwards in a loose cone, with the highest charge strength directly at the center and strength diminishing as both distance and offset angle increase. I believe that this occurs because the tip of the needle, where the radius of curvature is smallest, has the strongest electric field and will thus ionize more air than the narrowing portion. However, the e-field is not uniform and varies in direction, so the “electric wind” is not a unidirectional beam. The part of the data which did not support my hypothesis was the presence of charged particles even at a 90 degree offset from the needle. This may be because the sides of the needle themselves are spraying some charged particles (as the circumference of the needle is much less than that of the sphere).
The shape of the needle used does seem to affect the distribution of charge, though not as much as I had expected. The use of a conductor with a flatter point resulted in a more gradual curve, but appeared to reduce overall charge strength. This makes sense, as the electric field would be less concentrated when the conductor‘s edge is not as sharp. The change of needle can be compared to changing the shape of a nozzle on a high-pressure water hose; a wider opening will result in less ‘pressure’ and the strength of the water will be reduced. Interestingly, the amount of charge the electroscope was capable of measuring appears to “max out” at a reading of 4- thus, I had to limit the time of exposure to particles so that this maximum would not skew the results. This may occur due to charge ‘leaking’ off the electroscope when charge concentration is high, for the same reason that the meter’s dial slowly returns to 0 once it is no longer receiving charge.
The investigation had several faults- primarily, the inaccuracy of the equipment I was using. A digital electroscope and an apparatus with which to hold the receiver in place at a set distance would both improve the accuracy of the experiment significantly, allowing me to take more accurate data and prevent minor changes in fixed variables like distance or time. The data I received using my initial setup was erratic- I had to place the foil under the electroscope to prevent it collecting the charged particles striking the scope itself. Originally, I did not ground the receiver after taking a data point- residual charge in the electroscope skewed my data, and eventually I determined that the level of charge had to be ‘reset’ to take an accurate reading.
My results indicate several options for further investigation. Other experiments involving data of this type could include testing the electric wind produced by conductors of different radii and length as well as different shapes, or determining the type of conductor that would create the most tightly focused beam of electrons. Also, experiments could be conducted to determine the effects of air currents on the spray of charge- I believe that more air particles contacting the e-field of the needle would result in more charged particles being sprayed. Finally, research could be conducted to determine the magnetic effects of a Van de Graff with a pointed conductor attached- to determine how the movement of ionized particles affects the magnetic field in the region of the point. My experiment yielded interesting (and occasionally surprising) results, and I believe further investigation in this area will prove just as enlightening.
Bondar, Henri. "History and Basis: The Electric Wind." Electrified Fluid Mechanics. 10 Jul. 2004. 28 Oct. 2005
http://membres.lycos.fr/plasmapropulsion/Historical_&_Basic/Electric_Wind.htm.
Bram, Leon L. "Van de Graaff Generator." Funk & Wagnalls New Encyclopedia. 1st ed. 1990.
Katz, Eugenii. "Robert Jemison Van de Graaff." Biographies of Famous Scientists. 18 2002. Hebrew University of Jerusalem Institute of Chemistry. 28 Oct. 2005
http://chem.ch.huji.ac.il/~eugeniik/history/graaff.html.
Mitchell, Shawna. "Ion Wind." Physics Demonstration Resource. 31 Oct. 2004. Saint Mary's University. 28 Oct. 2005
http://www.ap.stmarys.ca/demos/content/e_and_m/ion_wind/ion_wind.html.
Zavisa, John M. "How Van de Graaff Generators Work." HowStuffWorks. 22 Oct 2005. HowStuffWorks, Inc. 28 Oct. 2005
http://science.howstuffworks.com/vdg2.htm.
Here are some other good links to sites discussing the Van De Graaff generator, the electric wind, and fun experiments you can do with the generator. Enjoy!
Amasci.com - A good site with experiments and instructions on how to build your own Van de Graaff generator.
Boston Museum of Science: VDG Histoy - A page on the history of the Van de Graaff and some early versions. (Warning--lots of images!)
BNL Tandem - Brookhaven National Laboratory's website for their Van de Graaff ion accelerator. A bit technical.
The Science House: Demos - List and directions for all the fun experiments you can try with your generator! This is a good site for physics teachers with too much time on their hands.
American Antigravity - A site describing current 'lifter' technology, which uses high-voltage charge to counteract gravity. This is really interesting.