Champagne Flute Frequencies
A study of density’s effect on frequency.
Lisa Jacobson
The concept of using glass as an instrument has existed for hundreds of years. The Chinese, Persians, Japanese, and Arabs all created music by using sticks to hit glasses filled with water. However, it was not until 1743 that Richard Puckeridge came up with the idea of rubbing the rim of the glasses with a wet finger (Bloch). Inspired by this concept, Benjamin Franklin invented in 1761 the instrument known today as the glass harmonica (“Ben Franklin”). To change the pitch, he manipulated the glass bowl depth and diameter (Bloch). However, since it is difficult to adjust these variables without expensive materials, my goal is to instead find the relationship, if any, between the density of the liquid and the frequency at which the champagne flute filled with that liquid resonates. Because of its availability, I will use sugar to manipulate the density.
Sound is explained by the Macmillan Encyclopedia of Physics as being “carried through waves that propagate through elastic materials and cause alterations in pressure.” Giancoli (1998) clarifies this definition, saying that the source of sound is vibration. In this way, the source of sound of a glass harmonica can be explained, because as a finger rubs the rim of the glass it alternately catches and releases, leading to vibrations (Bloch). However, the speed of vibrations varies based on the medium (solid, liquid, gas). This is because a sound wave moves through the collisions of molecules. Therefore in a solid, with tightly packed molecules, there is a faster speed of sound than in a loosely packed gas (Soundry). This principle is directly reflected in Giancoli’s estimated values of the speed of sound in glass (4500 m/s), water (1440 m/s), and in air (343 m/s). Therefore, I hypothesize that as density increases, the frequency will also increase, because in denser liquids the molecules are more tightly packed, resulting in a faster velocity. Since f = v/λ as velocity increases, so will frequency (Giancoli). In this experiment, frequency is defined as the compressions per second, measured in hertz, of the sound wave (Couper). Density is defined as the mass over volume, or kg/m³, of the liquid (Giancoli). All other variables, including the methods of measuring density and frequency, the amount of liquid used when measuring frequency, and the temperature of the liquid, will remain constant.
- 24% lead crystal champagne flute, 8 oz. capacity
- 1000 milliliter graduated cylinder
- triple beam balance
- 500 gram counterweight
- tuner
- sugar
- water
- stove

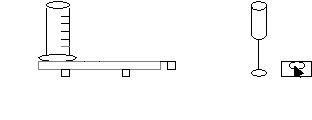
After gathering the needed materials and apparatus, I first calibrated the triple beam balance and checked that it was set at 0 grams to ensure accurate measurements. I then weighed the mass of the empty graduated cylinder. I would later subtract this mass, 188 grams, from the mass measurements of the liquids to guarantee that I was calculating the density of the liquid only. Next, I determined the density of pure water by finding the mass and dividing by the volume. The 500 gram counterweight was needed to measure the mass because the total mass of the liquid and the graduated cylinder was greater than the 610 gram capacity of the triple beam balance. I converted the density from g/ml to the standard units of kg/m3 by multiplying by 1000. I then poured 100 milliliters of this water into the champagne flute. While rubbing a wet finger around the rim of the glass, I used the tuner to determine the frequency at which it was resonating, and recorded this frequency in a data table. Following this procedure, I boiled water on a stove and added sugar until the mixture was saturated and no more sugar would dissolve. After allowing the liquid to cool, I calculated the density of this sugar water mixture with the same methods I had used for the pure water. I actually had to do this step twice because the first time the sugar water was not uniformly mixed. I found the difference in density between the water and the sugar water to be approximately 382 kg/m3. In consideration of time constraints, I decided to use ten different densities of sugar water with a 38 kg/m3 difference between each increment. For each density I measured the frequency at 100 milliliters as I had with the water. To manipulate the density, I added water to the saturated sugar water mixture, measuring the density periodically until I reached the next density measurement I wanted to test. Also, after testing two densities, I decided that to allow for further investigation of density’s effect on frequency, I should attempt to discover how much water was needed to produce ten different pitches of a chromatic scale. I started with A, the highest in tune pitch the glass would produce, and by adding water and measuring the pitch with the tuner I was able to record the volume of water needed for every pitch up to C. I was unable to continue the process any further because at C the glass was almost full. I repeated this process for each increment of density, including pure water. For the two densities that I had tested before this procedure, I used some left-over liquid that I had kept from the saturated sugar water mixture.


Δ Density = density (Δmass/mass + Δvolume/volume)
Δ1373 = 1373 (.2/686.7 + 5/500) = 14.1 kg/m3
Δ1335 = 1335 (.2/667.5 + 5/500) = 13.8 kg/m3
Δ1297 = 1297 (.2/648.5 + 5/500) = 13.4 kg/m3
Δ1259 = 1259 (.2/629.5 + 5/500) = 13.0 kg/m3
Δ1221 = 1221 (.2/610.5 + 5/500) = 12.6 kg/m3
Δ1183 = 1183 (.2/591.5 + 5/500) = 12.2 kg/m3
Δ1145 = 1145 (.2/572.5 + 5/500) = 11.9 kg/m3
Δ1107 = 1107 (.2/553.5 + 5/500) = 11.5 kg/m3
Δ1069 = 1069 (.2/534.5 + 5/500) = 11.1 kg/m3
Δ1031 = 1031 (.2/515.5 + 5/500) = 10.7 kg/m3
Δ991 = 991 (.2/495.6 + 5/500) = 10.3 kg/m3
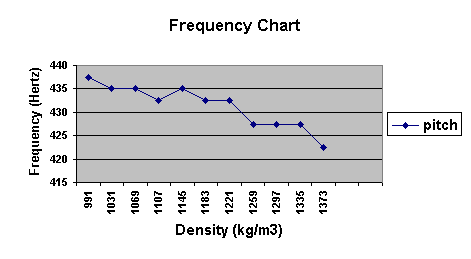
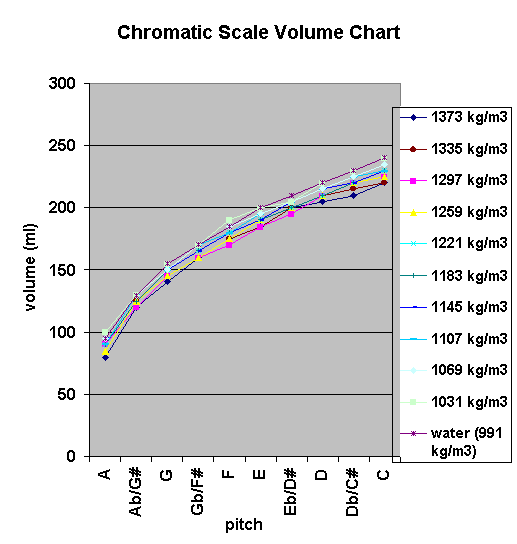
My hypothesis that the frequency would increase as the density increased was not supported. In fact, these two variables appear to be inversely related, with the frequency decreasing as the density increased. This relationship is most clearly illustrated through a comparison of the two extremes, pure water and saturated sugar water. Water, with the lowest density (991 kg/m3) produced the highest frequency of 437.5 Hertz. In contrast, with the density increased to 1337 kg/m3 for the saturated sugar water, the frequency was lowered to 422.5 Hertz. This relationship is supported by the different volumes needed to produce each pitch of a chromatic scale. As illustrated in the chromatic scale chart, consistently at each pitch as the density increased, less liquid was needed. For instance, 240 milliliters of 991 kg/m3 water was needed to produce a C while only 220 milliliters was needed of 1373 kg/m3 to produce the same pitch.
It is possible that this relationship between frequency and density can be explained based on the concept of inertia. Giancoli (1998) defines inertia as the “tendency of a body to maintain its state of rest or of uniform motion in a straight line.” This same concept is present in Isaac Newton’s first law of motion, stating that a body “continues in its state of rest or of uniform speed in a straight line unless acted on by a nonzero net force” (Giancoli). Additionally, mass can be defined as a “measure of the inertia of a body” (Ibid). More mass means that it is harder for a body to change its state of motion. When applied to this experiment, this means that the denser liquid, the saturated sugar water, has more mass, and as a result has more inertia. Therefore, the denser sugar water would produce a lower frequency than the pure water because it is harder to change its state of motion and produce the compressions that are measured to determine the frequency.
However, there is some error and uncertainty within the methodology that could affect the results. The accuracy of the apparatus used added uncertainty to the calculated densities and frequencies. For example, I estimated the degree of uncertainty of the triple
beam balance to be .2 grams. When added to the 5 milliliter uncertainty of the graduated cylinder created by the meniscus of the liquid, this results in a total uncertainty of the density to be between 10 and 14 kg/m3. Although this is a relatively large uncertainty when the densities were only 38 kg/m3 different, hopefully by testing eleven different densities I was able to reduce its impact of the overall results. Another uncertainty relating to an apparatus is the sensitivity and accuracy of the tuner. I’ve estimated that the frequency could vary by as much as two Hertz as a result of the needle swinging back and forth. Fortunately, this would not greatly change my interpretation of the relationship between density and frequency, since the frequencies of pure water and saturated sugar water vary by 15 Hertz. These uncertainties along with any human error could be reduced by completing additional trials for each density. If sufficient time was available, this would be a simple way to increase the accuracy of the results. A similar effect could be achieved through the use of more sophisticated apparatus.
My experimentation with density has caused me to think of several additional areas for subsequent research. For instance, it would be amazing if one could determine the density of a liquid simply by measuring the frequency and plugging the value into a density-frequency formula. Also, I determined density’s effect on frequency, but what about temperature? Would altering the water to nearly a gas or solid through boiling or freezing have a greater effect? Would that alteration be significant enough to overcome the effect of inertia and thus support my original hypothesis? Also, since Benjamin Franklin altered the glass depth and diameter, it would appear that those variables are most efficient in affecting the frequency, but are there other, equally efficient methods? These new research questions would be fascinating to study in greater detail.
“Ben Franklin and the Armonica.” Gigmasters. 2002.
<http://www.gigmasters.com/armonica/history/html>.
Bloch, Thomas. “The Glass Harmonica.” G. Finkenbeiner
Inc.
<http://www.finkenbeiner.com/HARMONICA.htm>.
Couper, Heather and Nigel Henbest. Physics: Matter,
Energy, and Mechanics.
Franklin Watts, 1983.
Giancoli, Douglas C. Physics: Principles with
Applications.
Education, 1998.
Rossing, Thomas D. “Sound.” Macmillan Encyclopedia of
Physics.
and Schuster Macmillan, 1996.
The Soundry: The Physics of Sound.
An interactive site that investigates the physics of sound, comparing frequency, amplitude, interference patterns, etc. I found this to be a helpful refresher for the concept of sound waves.
http://www.physicsclassroom.com/Class/sound/soundtoc.html