THE RELATIONSHIP BETWEEN ANGLES OF ELEVATION AND DISTANCE IN REGARDS TO ROLLING FRICTION
By Elise K. and Shannon L.
Background:
Friction is the force that opposes the motion between two or more objects. The amount of friction between two objects depends on how smooth of rough a surface is and the pressure between them. However, no surface is perfectly smooth, therefore, all object will experience friction when interacting with other objects. If a surface is smooth or oiled, the object is more likely to proceed at faster speeds than bumpy and rough surfaces. Additionally, rolling friction is caused by the interference of indentations however small or large as one surface rolls over another. Rolling friction is dependent on both the tread of the wheel as well as the track it is traveling on. Lastly, as the wheel continues down the track or surface it loses energy. This energy loss is caused by the deformation that occurs when the two surfaces are compressed and relaxed.
Statement of the problem:
The purpose of this experiment is to determine a wheel’s tread friction coefficient and how it relates to the angle of elevation.
Review of Literature:
“Wheels are slowed by static
friction. A rotating tire’s point
of contact is momentarily static, so the tire is slowed by static friction. A
skidding tire is slowed by kinetic friction” (Gormick and Huffman). “The
coefficient of rolling friction is Ur=Fr/S when Fr=force of friction, S=normal
force, and Ur=Coefficient of rolling friction” (Gormick and Huffman). “Rolling
friction is the friction between a rolling wheel and the plane surface on which
it is rolling” (ed. Alan Isaacs). “The major source of energy loss during
rolling motion is primarily due to the deformation that occurs when the two
surface are compressed and relaxed”(webphysics). “Rolling friction is caused
primarily by the interference of small indentations formed as one surface rolls
over another” (webphyscis).
Hypothesis:
We hypothesize that the coefficient of rolling friction will be the greatest on the 50-grit sandpaper. It will get closer to zero after that in the order of 220-grit, bare track, and finally the oiled track. We also hypothesis this will be a consistent finding regardless of the angel of elevation.
Materials:
*Matchbox car tracks
*Matchbox car
*WD40 lubricant
*220-grit sandpaper
*50-grit sandpaper
*Paper towel
*Door hinge
*Wood
*Double sided tape
*Spray Adhesive
*Connecters
*Matchbox start gate
*Measuring tape
Design of ramp:
We designed the ramp to have three different angels of elevation: 30, 45, and 60 degrees. First, we made the base out of a wooden rectangle attached by nails. Then, we attached the base with the ramp, which was another slab of wood. This way the ramp was able to move to the three designated angles freely. Detailed drawings of the ramp is provided below:

This is a drawing of the front portion of our ramp.

This is a drawing of the side view of our ramp.
Experimental Setup:
After the ramp and base were complete, we proceeded to attach the four tracks used for our experiment to the ramp. Each track was adhered to the ramp by double-sided tape. The first track was left plain to act as the control group for the rest of the test trials. The second track was coated in the lubricant, WD40, using a paper towel. The last two tracks were layered with sandpaper, one with 220-grit fine course sandpaper, and the other with 50-grit course sandpaper. We used a spray adhesive to glue the sandpaper to the track. Because of the nature of the matchbox car, it was vital to extend the track to twenty feet for all lanes. This way the car would have enough time to stop on its own, thus eliminating a potential source of error. Additionally, a stop gate was positioned at the top of the ramps so that there was no error when releasing the car. Lastly, a measuring tape was extending along the track for accurate measurements.
Data Collection:
Before the data was collected, we made multiple charts to record the length that the car coasted along the track. Shannon, at one end, would push the start gate to let the car descend down the ramp. Elise would then retrieve the matchbox car and record the length the car traveled. This process continued, as we did 30 trials for each track on each angle, concluding in 90 trials per lane and 360 trials total. However, before we got the final data, we spent hours testing multiple cars on the track to insure their efficiency, and making sure the results were not sporadic. That was a problem that we ran into with three different matchbox cars. After experimenting down two tracks, the results would become inconsistent due to the wearing down of the wheels. However, a final car was consistent and was used for the experiment. Based on the formula for coefficients of friction, u=-tanO/(ya/LrcosO^3+1). U stands for the rolling drag coefficient, ya is the average coasting distance on the flat measured from the join in inches, O is the angle the ramp from with the horizon and Lr is the length of the ramp surface in inches. We measured the ramp’s length to be 30 inches, and the heights varied with the changing angles.
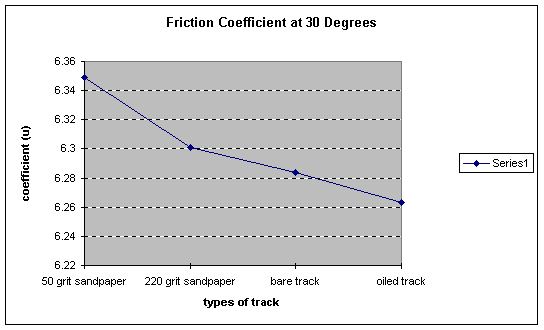
Below is the graph for the coefficients of friction at 30 degrees. As one can see the coefficients of friction get closer to zero as the friction on the surface has less resistance. The coefficient for the 50-grit sandpaper is 6.3487. For the 220-grit sandpaper the coefficient is 6.300885. For the bare track the coefficient was 6.0283798. The coefficient was 6.2631 for oiled track.

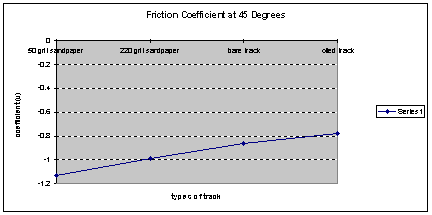
The next graph is for the coefficients at 45 degrees. Just like the above graph the coefficients get closer to zero as the friction of the track gets less. The coefficient for the 50-grit sandpaper is –1.135. The coefficient for the 220-grit sandpaper is -.98659. For the bare track the coefficient was -.85855. For the oiled track the coefficient was -.77897.

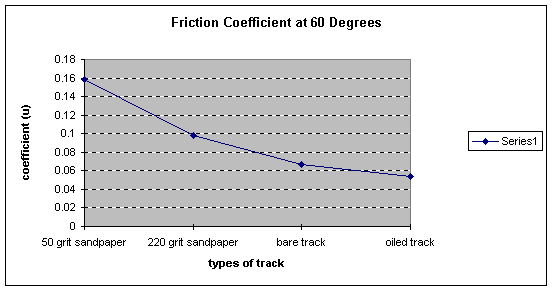
The final graph is of the coefficients of friction at 60 degrees. Just like the other two graphs the coefficient of friction gets closer to zero as the resistance on the track was reduced. The coefficient for the 50-grit sand paper was .158659. For the 220-grit sandpaper the coefficient was .0977. The coefficient for the bare track was .06658. For the oiled track the coefficient was .05377.

We found it somewhat interesting that the biggest jump in coefficient was between the 50-grit and 220-grit sandpaper at all angles. The smallest jump was between the bare track and the oiled track. The coefficient was the greatest at thirty degrees being 6.35 compared to the lowest, lubricated track, which was the lowest at 6.265. This same pattern continued with the other two angles, as seen in the graphs above.
We found that the smother the surface the closer to zero the coefficient was. Basically, we found that the track with WD40 had the least resistance. Then came the bare track, the 220-grit sandpaper track, and finally the 50-grit sandpaper track. These results were consistent at all three angles of elevation. We concluded that the uncertainty of the measurements was +/- two tenths of an inch. The uncertainty of the angles was +/- three degrees. The fact that we took 30 trials for each track at each angle, prove that our data is more statistically sound.According to our results, the data did support our hypothesis. As we suspected, the coefficient of friction was the highest for the course 50-grit sandpaper. The angle of elevation did change the coefficient in a consistent manner throughout the experiment. Therefore, we believe that our hypothesis was accurate. However, though out the course of our experiment, we ran into some sources of error. There were gaps between the sandpaper on the track that could have added to the resistance. On some of the trails the start gate caught and the car didn’t release immediately, that could have affected the distance the car traveled. We also considered that after the car going down the track so many times the sandpaper could have started to wear down. There were also bumps from the connectors that could have also affected the distance. Finally, we had to reattach the support that determined the angle so it’s possible that the angles weren’t completely consistent.
Clark, John and John Daintith, The Facts on File Dictionary of Physics. Market House Books Ltd., New York. 1999.
Gamick, Gary and Art Huffman, The Cartoon Guide to Physics. Harper Collins Publisher, New York. 1990.
Giancoli, Douglas, Physics. Douglas C. Giancoli, Rio de Janeiro. 1998.
Gunderson, P., The Handy Physics Answer Book. Visible Ink Press, Farmington Hills. 1999.
A Dictionary of Physics. Ed. Alan Isaacs. Oxford University Press, New York. 1996.
<http://webphysics.davidson.edu/faculty/dmb/PY430/Friction/rolling.html>*<http://webphysics.davidson.edu/faculty/dmb/PY430/Friction/rolling.html>
This site gives a great overview of rolling friction. It even includes a formula! And great diagrams that make rolling friction easier to understand.
*http://www.school-for-champions.com/science/frictionrolling.htm
This site talks a whole lot about rolling friction. It gives a great explanation about how friction causes a wheel to roll. It also gives formulas and pictures for better understanding. In addition it shows the roll torque plays in rolling friction.
http://www.worldforchrist.org/races/cars/why/yrollf.htm
This site gives a great explanation on how to measure for a rolling friction coefficient. It has lots of formulas with explanations of the variables and how to solve the equations.
http://www.nadn.navy.mil/Users/physics/mungan/Scholarship/RollingFriction.pdf
This site has really good diagrams of how force is involved in rolling friction. It also gives a really good explanation of the concept of rolling friction.
http://www.ptpleasantbch.k12.nj.us/bcallan/force/fric2.htmThis site gives a basic overview of the various types of friction, including rolling friction.