Small Particle Movement in a Uniform Gas Velocity Field
Trina Kalilimoku and Maike Scheller
- Planning B (the plan and procedure)
- Data collection in form of a table (as well as another diagram)
- The graph representing our data
- Analysis
- Conclusion and Evaluation
Wind erosion is the wearing away and moving of rock , soil and other materials. It is very hazardous to great hectors of land around the world. IN many ways, it is responsible for creating natural wonders like the Badlands, beautiful land sculptures formed by wind and water erosions (source #3).
Researchers Craig Strong, John Leys and Grant McTainsh (2002) have examined hoe disturbance of biotic crusts increases the erodibility of soil surface to wind erosion (#5). They have shown the relationship between the effects of wind erosion on sand in one case and in loam on the other. One result, among others, concluded that wind erosion has a greater effect on sand rather than on loam. One method they used to examine this was a wind tunnel. Faking a wind erosion above small particle, they collected eroded sand particles at each minute interval. With that data they were able to determine that wind has a freater effect on sand rather than on loam.
One way, among many others to reduce wind erosion, is to minimize the velocity at the soil surface, decreasing the small particle movement, in this case, the movement of sand (#4).
The purpose of those examinations was to find out how much the wind velocity, in this experience represented as wind erosion, affects different small particle movement, sand and loam in particular.
One experiment, focusing on "Theoretical Simulation of Developing Process of Wind-Blown Sand Movement", introducing the dependence of electrostatic force on sand movements, derived form various wind motions. The moving sand strongly depends on the wind velocity near the sand bed (#2). As the number of moving sand particles increases to a certain value, it can be concluded that a higher wind velocity was forced onto the small particles due to the direct relationship between wind velocity and the sand particles. The movement of sand particles shows, after careful observations, that sand grains tend to ,pve forward in a series of jumps, by a progress known as saltation. Wind by itself cannot pick up sand particles from the ground. Sand particles are thrown into the air only under the impact of other particles. When wind reaches a critical velocity, grains of sand begin to roll forward along the ground surface. If a rolling grain collides with another, the impact may lift either particle into the air. The force acting on the particles than are gravity as well as horizontal velocity (#4).
With the given background information, my lab partner and I will investigate the effects of wind velocity has on small sand particle movements in a certain time interval. It seems relevant to conclude that the higher the wind velocity is the more small particles will be moving. We hypothesize that a small change in windspeed (m/s) will greatly affect the sand particle movement (g/min) represented by an exponential curve on our graph.
Physics-Planning B (Top of Page)
The materials we used:
-lot’s of wood (to build three different types of boxes)
-nails, hammer, clue, saw, in order to mount everything together
-sand, of course (to be our small particles)
-a scale that measures small amounts of grams
-straws (for a good airflow)
-and wind speed (here produced by different hairdryers)
-a ping pong ball and a protractor (and some knowledge of the Beaufort wind scale)
So here is our plan...
The contraption we built needed to have a constant airflow in order for our data to be accurate. We were able to build a wooden box, about 3 feet long, 1 foot wide and 1 foot high, with 3 different chambers large enough to hold a hair dryer at different distances from the front of a box. In the front of the box, we cut out another small box, approximately 3 inches long and 1.5 inches high, in order to put straws through to direct the airflow in a straight path.
Next to the front of the box, we placed another box filled with dry, sifted sand that, when the hair dryer was turned on, would be blown into another box whose function would be to catch the sand particles that were blown away. In our experiment, we needed two different variables: the mass of the sand blown away and the wind speed of the different hair dryers. Using the Beaufort wind scale, a protractor and a ping pong ball, we were able to measure the different wind speeds of each of the hair dryers. After a few trials, we realized that in order to get the most accurate measurements, we needed to find a way so that the sand would not blow everywhere and would only blow into the third box so we added “walls” around the apparatus.
(side view)
By turning on the hair dryer and setting it at the appropriate setting, without plugging it into an outlet, we were able to reduce the possibility of having to deal with an unsteady flow of air by just putting the hair dryer in and automatically turning on when we plugged in the cord.
(there is another diagram underneath the data table)
Results of the data collection: (Top of page)
|
|
Degree |
Wind speed (m/s) |
Grams/Minute (g/min) |
Multiplied to obtain the full 60 sec |
final (g/min) |
|
low |
82.5 |
9.75 |
38 |
38 |
|
|
83 |
9.1 |
36 |
36 |
||
|
82 |
10.4 |
42 |
42 |
||
|
81.5 |
11.05 |
58 |
58 |
||
|
82 |
10.4 |
41 |
41 |
||
|
82 |
10.4 |
39 |
39 |
||
|
medium low |
77.5 |
15.1 |
5 |
mult. 6 |
35 |
|
77 |
14.8 |
10 |
60 |
||
|
77.3 |
15 |
6 |
36 |
||
|
77.2 |
14.9 |
10 |
60 |
||
|
77.4 |
15.2 |
11 |
66 |
||
|
77 |
14.8 |
10 |
60 |
||
|
medium |
75 |
16 |
130 |
130 |
|
|
74 |
16.6 |
135 |
135 |
||
|
74.5 |
16.3 |
142 |
142 |
||
|
76 |
15.4 |
125 |
125 |
||
|
73 |
17.2 |
143 |
143 |
||
|
74.5 |
16.3 |
140 |
140 |
||
|
medium high |
70 |
19 |
108 |
108 |
|
|
70.5 |
17.5 |
138 |
138 |
||
|
70.4 |
19.4 |
204 |
204 |
||
|
71 |
18.4 |
90 |
90 |
||
|
70.5 |
18.6 |
216 |
216 |
||
|
70.9 |
18.3 |
168 |
168 |
||
|
high |
63.5 |
22.25 |
50 |
multi. 12 |
600 |
|
|
64 |
22 |
36 |
432 |
|
|
|
65 |
21.5 |
35 |
420 |
|
|
|
63 |
22.5 |
48 |
576 |
|
|
|
64.5 |
21.75 |
40 |
480 |
|
|
|
63 |
22.5 |
38 |
456 |
Further investigations of the results
Some important information in order to understand this data collection is needed. First of all, since there are 5 different wind speeds, I either used one hairdryer alone (lowest speed), two together (medium speeds), and the fan for the highest wind speed. The medium wind speeds are subdivided into three different wind speeds: medium low, medium, and medium high. Medium low was obtained by using both hairdryers on the lowest power level. Medium was obtained by turning both on the medium power level. Medium high was produced by both hairdryers to the uppermost power level.
Further analysis of the data table suggest that medium low as well as high were only measured for a certain time interval within the one-minute time interval. This was an easier way to control the sand particle movement. However, this was not needed for each individual wind velocity. I needed this configuration in order to “catch” as many particles as possible. In simpler words, I wanted to reduce the uncertainty and this is how I did it: I let the hairdryers run for a specific time interval within a minute and then multiply by an integer in order to re-obtain the 60 seconds. I did this for medium low as well as high (the wind velocities) since the force was so great that, if I would not have shut off the hairdryers, the small sand particles would have not been caught in the bucket. It is important in this experiment to be able to have a specific amount of control.
The most important columns within the data table are Wind speed (m/sec) and the final (grams/minute) since this will determine the graph.
The following graph represents the given data point in the table which is shown above:
|
By looking at the graph, the data points seem to fall along a line of best fit (also know as trendline). The points located at around ten of the x-axis represent the lowest wind speed, the points located at the center of the trendline represent the medium wind speeds, and the highest data points located near the end of the trend line at about 22 on the x-axis, represent the highest wind speed. The equation derived from the data points is shown in the top right corner of the graph. The axes are labeled with a title that corresponds to the data table shown on the previous page.
The data seems to support my hypothesis. As mentioned in the introduction, the small particles, in this case sand, will be increasing in an exponential form which can be seen by looking at the graph. I found out that a small increase in the speed of wind (m/s) has a great effect on the rate of transport. Each trial consisted of six individual trials in order to make the experiment as accurate as possible, however, there were some errors or limitations which, in the researchers condition could not have been improved. I will cover several limitations and weaknesses within the concluding paragraph.
Referring back to the collected data, the graph turns out to be fitting what I hypothesized, but why is this so? One of the major reasons why it is growing exponentially is the role of the force due to the wind speed. The wind slightly touches individual sand particles which then forces them to move. Since their mass is so minimal, the wind has no problem in picking up individual or, as seen in the research project, groups of small particles and moves them across the area. Now, to use this background information, I can predict that the collisions of small particles will involve the idea of momentum. Since momentum can be neither lost or gained, the particles at rest need to receive some of the momentum given from the moving particle. Since momentum has to do with mass and acceleration, it is impossible for both particles to drop dead after the collision occurred since force and gravity both affect the motion of the small particles. The energy of the wind would also depend on E= (.5)mv^2 which relates to the idea of momentum. In this research project, momentum is one great factor that contributes to my hypothesis.
Another major factor is the constant wind speed that forces the particles to move in the first place. Without the wind speed nothing would have moved. Gravity also has its effects on the particle movement in this uniform gas velocity field. Since the particles have minimal masses, gravity is able to force the particles downward. However, the acceleration coming from the wind speed forces the particles at the same time to move forward. When colliding with resting particles, those particles receive momentum, flying off. Gravity will pull those particles downward all over again and the wind speed will force the particles forward, making them collide with more particles, triggering more particles to fly in the air.
The following diagram will demonstrate the idea behind the sand particle movement:
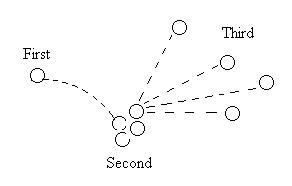
The concept of momentum, force, and gravity are all intertwined with each other
since they work, in this particular experiment, together in order to achieve a
logical conclusion: sand particle movement is exponentially proportional to the
wind velocity.
Evaluation and Conclusion (Top of Page)
Based on the recorded data and the graph, We hypothesized right. As we mentioned in the introduction, the small particles, in this case sand, will be increasing in an exponential form which can be seen by looking at the graph. We found out that a small increase in the speed of wind (m/s) has a great effect on the particles that moved. Each trial consisted of six individual trials in order to make the experiment as accurate as possible, however, there were some errors or limitations which, in the researchers condition (us), could not have been improved. After having some difficulty coming up with a good procedure, we began building an apparatus to help us collect relevant data points (as described and shown in previous parts of the paper).
Nevertheless, there were still limitations, weaknesses and errors occurring in our procedure/data collection. A fairly big limitation was that we were only able to use wood which, at some time, was hard to adjust. Also, specifically the box filled with sand, kept the particles in certain areas instead of the container at the end catching them. If the boxes were made out of plastic and would have been continuous (without any gaps), the possibility for a better data collection would increase slightly.
Also, the major weakness was, getting the hairdryers in the right position in the big box and managing to get various windspeeds. We had to try out different possibilities how to hold the dryers and when the efficiency would be the best. We needed strong enough hairdryers so that the wind would pass through the straws which was, at the beginning, rather difficult but at the end manageably easy. Some errors we encountered throughout the process was that some particles were blown in a totally different direction, decreasing the accuracy of our final measurements of how many grams after a minute were left. Since some of the windspeeds were rather powerful, we only timed for 30 seconds or even for just 10 seconds and multiplied the final result by an integer which would reach 60 seconds again. This could also have reduced some of the accuracy in the final outcome.
The problem with the sand particles going everywhere could be reduced by enclosing the sand in a box and separated it from another box that would catch the particles after each trial. This would divide each station more smooth than our apparatus did. For the timing issue, just improving the container capturing the particles and enclosing them more (as I just mentioned) would help to improve the accuracy of the final sand particle movement.
1. "Activity - Measuring Wind Speed." . <http://www.bom.gov.au/lam/Students_Teachers/Worksheet16.shtml>
(Activity - Measuring Wind Speed)
<http://www.lbk.ars.usda.gov/wewc/icar5/individuals/57.pdf >
(Particle-size characteristics of wind eroded sediments from disturbed biotic crusts in south east Australia, by Craig Strong, John Leys and Grant McTainsh)
3. "Wind and Deserts." . <http://www.geo.ua.edu/intro03/wind.html>.
(Wind and Deserts)
(Wind and Deserts: Movement of Sand Particles and Wind Erosion)
5. Zhou, You-He . "Theoretical Simulation of Developing Process of Wind-Blown Sand Movement." . <http://www.ttp.net/0-87849-913-X/589.htm>.
(Theoretical Simulation of Developing Process of Wind-Blown Sand Movement)