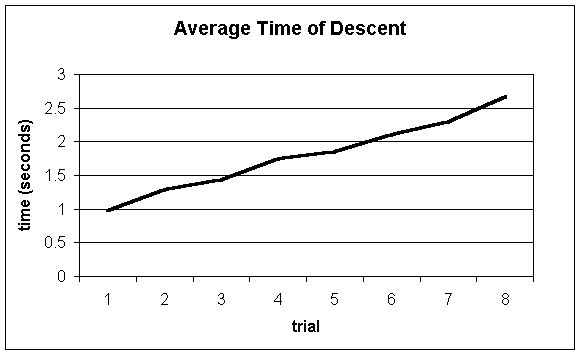
Raw Data (in excel spreadsheet)
Raw Data (text)
The idea of the parachute may well have been with us since the idea of flight, though it was first recorded in the 15th century. Artist and inventor Leonardo DaVinci is believed to have pioneered the idea in one of his journals. One such journal contained an entry that read “if a man has a tent made of well-primed canvas about 12 braccia across and 12 high, he will be able to throw himself from any height without harming himself” (Bramly). With the entry were multiple drawings of an apparatus resembling the design of the modern parachute, which was not produced until centuries later.
Within the modern design, there are many variables influencing the parachute’s rate of descent. Most obvious is the mass of the object to which it is attached. The shape, diameter and material of the parachute also have a large role in this, as does the presence and size of a hole in the apex of the chute which is sometimes used to stabilize descent (ppcrg.com).
The purpose of this investigation is to find the relationship between with diameter of a parachute and its rate of descent, if such a relationship exists.
The
round design seems the most appropriate for a study of the rate of descent of a
parachute on a smaller-than-life scale. In
this study, the independent variable is the diameter of the parachute used, and
the dependent variable is the rate of descent of the parachute, measured by its
terminal velocity. The researchers
hypothesized that the average velocity would decrease as the diameter of the
parachute was increased.
Materials
Paper (for parachutes)
String
Tape
Paratrooper
Stop watch
Scissors
Compass
Platform
Calculator
Procedure
1. Use the compass to draw circles of varying diameter (4 cm, 8 cm… 28 cm) on the paper, and cut out.
2. Cut 4 strings of equal length for each parachute and tape equidistant from each other around the edges of the parachutes.
3. Time the drop of the paratrooper from release to striking the floor. Record the time it takes to drop without a parachute, then with each diameter.
4. Repeat step 3 five times for each diameter.
5. Calculate the mean time of each group of five data points.
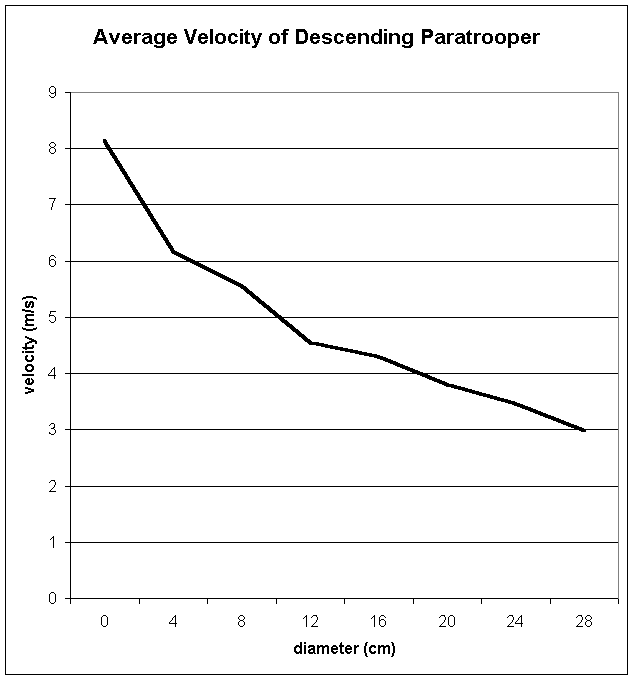
6. Apply the formula s=(u+v)(1/2)(t), using the mean time for "t" to get the average velocity of the descent.
7. Graph and analyze the data.
|
|
0 |
4 |
8 |
12 |
16 |
20 |
24 |
28 |
|
1 |
0.96 |
1.34 |
1.34 |
1.76 |
1.94 |
2.08 |
2.38 |
2.52 |
|
2 |
1.07 |
1.3 |
1.42 |
1.6 |
1.94 |
1.89 |
2.15 |
2.6 |
|
3 |
0.88 |
1.22 |
1.41 |
1.71 |
1.78 |
2.4 |
2.2 |
2.84 |
|
4 |
0.9 |
1.4 |
1.55 |
1.88 |
1.79 |
2.03 |
2.33 |
2.79 |
|
5 |
1.1 |
1.22 |
1.47 |
1.82 |
1.83 |
2.12 |
2.47 |
2.65 |
|
MEAN |
0.982 |
1.296 |
1.438 |
1.754 |
1.856 |
2.104 |
2.306 |
2.68 |

Now apply the formula s=(u+v)(1/2)(t) where s=the distance dropped (4 meters), u=initial velocity (0 m/s), v=final velocity (the variable we are solving for), and t=average time of descent for each diameter. Simplified, the formula is v=8/t.
|
|
0 |
4 |
8 |
12 |
16 |
20 |
24 |
28 |
|
average
velocity |
8.147 |
6.173 |
5.563 |
4.561 |
4.31 |
3.802 |
3.469 |
2.985 |

As the data clearly displays, the hypothesis was supported; the average velocity of the paratrooper did decrease as the diameter of the parachute increased. As the graph above suggests, the descending curve appears to be exponential. This can be researched further, for greater certainty, using larger parachutes in order to collect 15 or so data points, rather than a respectable, but almost insufficient, 8 data points.
There are a few errors that the researchers should correct when performing the experiment again. A more responsive (buttons that don’t stick) stopwatch would dramatically improve the experiment, as would a chamber without drafts (i.e.: from the heating vents), so that the paratrooper wouldn’t soar back and forth in the air before landing. Apart from these few alterations that should be made, the experiment was largely a success.