The
Effect of Drag of a Note Card on the Speed of a Pinewood Derby Car down an
Incline Plane
Kellen Comrie
Table of
Contents:
Physics I.A. text data .:.
Excel
Introduction: The
force of drag is often experienced in daily life, such as whenever you toss or
throw anything, or how efficient or fast you can drive depending on the shape
of your car. But it becomes paramount in the world of aviation, minimizing and
accounting for drag in the creation of planes and rockets is
very important. I wanted to visualize how much drag something creates on
a object and I had a pinewood derby car from when I
was 7 years old that could serve as a viable subject. My experiment uses force
equations such as F=ma which finds the total force acting on an object(F) that accelerates and S=1/2at^2 which
was what I used to find the acceleration of car(a).
Research Question: What is the Effect of Drag
of a notecard on the Speed of a Pinewood Derby Car
down an Incline plane?
Hypothesis: The larger the surface area of the notecard the more drag and the lower the speed
Variables: The independent variable is the
size of the notecard with the length and angle of the
plane and the pinewood car remaining constant the only dependent variable was
the speed of the car
Materials:
- Pinewood derby car
- Notecard
- Stopwatch
- 4 ft long wood board
- Block to hold board up
- Scissors
- Tape
- Ruler
- Google sheets
- Ti-84 plus CE calculator
- Foam pad
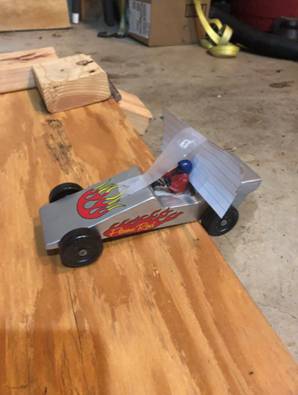
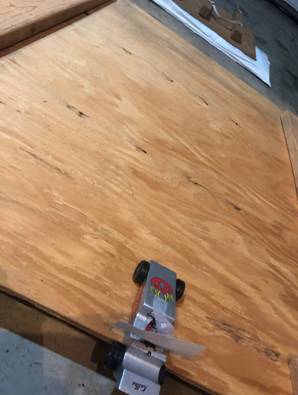
Photos of Setup:
Procedure: The best way to keep the times
consistent was to balance the car’s back wheel on the edge of the board. then release the wheel and start the timer at the same time.
Wait for the back wheel to roll off of the board and end the timer. I would
repeat this five times. Then place a cut to size notecard
on the car and tape it in place. Repeat rolling and timing five times, then
remove the notecard, cut it to size, and replace on
car. Repeat until you have 5 sets of 5 data points. Move data to a google sheet and create a graph and used my calculator to
find the acceleration in feet per second of the average velocity of a notecard using S=1/2at^2 where S= 4 ft, t= average
time of the five points and solved for a. Then I converted the
acceleration to meters per second and calculated the total force using F=ma where m=
5 ounces, and a= the acceleration found earlier and got the force in newtons. I subtracted the force of a car with notecard for the force of the car without the notecard to find the force drag.
|
Area of NoteCard(cm^2) |
Time(s) |
|
0 |
1.91 |
|
2.04 |
|
|
1.94 |
|
|
2.03 |
|
|
1.93 |
|
|
40 |
2.16 |
|
2.09 |
|
|
2.06 |
|
|
2.1 |
|
|
2.05 |
|
|
50 |
2.16 |
|
2.05 |
|
|
2.23 |
|
|
2.13 |
|
|
2.05 |
|
|
60 |
2.19 |
|
2.13 |
|
|
2.09 |
|
|
2.26 |
|
|
1.99 |
|
|
70 |
2.24 |
|
2.18 |
|
|
2.13 |
|
|
2.19 |
|
|
2.26 |
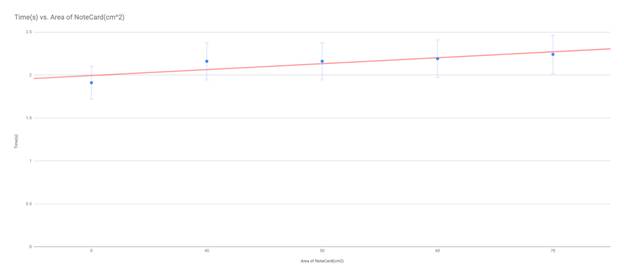
Table and Graph 1 represent time vs the
surface area of the notecard
Processed data:
|
Card size(cm^2) |
Acceleration(ft/s/s) |
|
0 |
2.0614 |
|
40 |
1.828 |
|
50 |
1.7733 |
|
60 |
1.76 |
|
70 |
1.6529 |
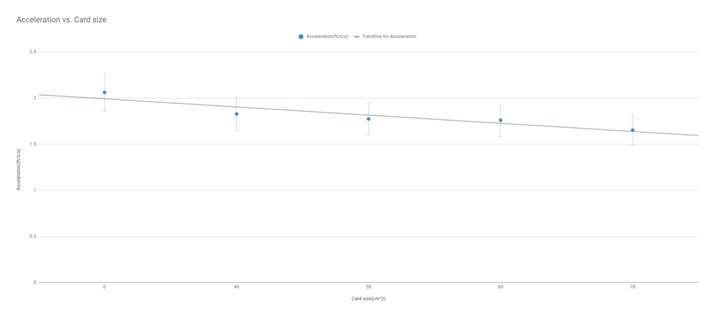
Table 2 and graph 2 represent the acceleration of the pinewood car
for each size of notecard
|
Acceleration in m/s/s |
force in N |
|
0.6283 |
84.08 |
|
0.5571 |
78.99 |
|
0.5405 |
76.63 |
|
0.5365 |
76.06 |
|
0.5038 |
71.43 |
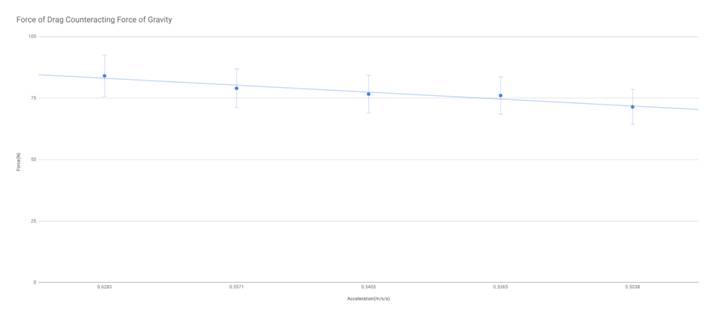
Table 3 and graph 3 represent the total force on the car as it
traveled down the plane for each size of notecard.
|
Card size(cm^2) |
Force of drag(N) |
|
40 |
5.09 |
|
50 |
7.45 |
|
60 |
8.02 |
|
70 |
12.65 |
Table 4 represents the force of drag the notecard
provided to the pinewood car
The force of drag increased with the surface area of the notecard proving my hypothesis. This is supported by graphs
2 and 3 and table 4 with the highest drag belonging to the 70 cm^2 card. And
the lowest acceleration also belonging to the 70 cm^2 card and the graphs trend
lines are also down.
Evaluation: The raw data of this study is wildly
inaccurate, By myself I would both time and release the car at the same time
then listen to the back wheels to clack off of the board to end the time, There
should have been another person releasing the car and I could have solely
timed. creating inconsistent times. The board that the
car rolls down is flat but has uneven smoothness adding another layer of
uncertainty to this experiment. This experiment also neglects the acceleration
of the wheels and friction of the board or air along with any effect the tape
may have and on the drag as well. The calculations of
the force and acceleration was based off of a rounded average time for a
notecard size. If I were to redo this experiment I
would lengthen and sand the board down, have another person release and I would
time (or better yet get a computer timing system). I
would also have purpose built the car to this experiment, so that the use of
tape would not have been needed. And I would run more trials for each card size
along with using more card sizes.
Covers
Traditional Drag forces but is focused on free fall while mine is based in
incline planes.
University
of Sydney sail force coefficients
Covers
forces at level planes but is mostly focused on wind forces rather than drag.
Pinewood
Derby wind resistance
Talks about wind resistance of car itself without a sail or notecard or parachute. Summary of
next source.
Pinewood
Derby wind resistance Video
Video
that covers how the aerodynamic profile of a pinewood derby car changes the
speed of the car.
I
saw this video years ago and liked the concept of adding
harder science to these competitions and used the advice to do place well in
said races.