What is the relationship between temperature and viscosity of a fluid?
Chris Wise
Table of contents: Background Information - Design - Variable - Data - Calculation - Graphs - Conclusion - Related Sites - Bibliography - Return to Research
Background Information .:. Top
Viscosity, in its most fundamental definition, is resistance to flow (McGregor). More particularly, viscosity is the measurement of the interactions between different molecules, or as the friction of the particles in a fluid. This friction is what determines how ‘hard’ it is for a fluid to flow and how much energy it takes to do so. One can think of a fluid’s ‘thickness’ as a judge on how viscous a fluid is; take for example water, which flows very easily compared to something like oil. However, viscosity doesn’t always directly relate to the density of a fluid (take the previous example, where water is more dense than oil but less viscous).
Because viscosity is a measurement of the interactions of different molecules, as the temperature increases, the average speed of the molecules also increase. This decreases the forces between the molecules, making the liquid less viscous the more energy is added. As the temperature decreases, the molecules decrease in speed and therefore are more forced upon by the interactions with other molecules, making it more viscous.
This is important in modern manufacturing because if the temperature of a lubricant increases, then it will because less efficient and slow down. This is also a problem with aerospace engineering, which is why I this is an interesting topic for me. The higher in altitude that a jet is, the colder that the gas and oil get, making it viscous and hard to use at an instant when it’s needed.
Statement of the Problem:
The purpose of this investigation is to determine the relationship between temperature and viscosity of a fluid.
Hypothesis:
I believe that as the temperature increases from 0 degrees celsius to 70 degrees, the molecules being held together by intermolecular forces will decrease as the speed of the molecules increase, causing the syrup to become less viscous. This will then cause the ball bearing to fall through the syrup faster, meaning that it has become less viscous. Viscosity is as the density of both the ball bearing and the syrup by dividing the mass over the volume. The independent variable of the experiment is the temperature of the syrup, which will be measured in degrees centigrade.
Design .:. Top
The purpose of the lab was to determine the relationship between temperature and viscosity of a fluid, specifically that of Corn Syrup. The way that was accomplished was by heating 1010 ml of corn syrup in a 1000 ml beaker, then dropping a ¼ inch ball bearing though that was previously measured for density. The syrup was closely monitored with a thermometer until it dropped to around 21 C or room temperature, and was then cooled in a bucket of ice until 12 C and heated back up. This will all be recorded by a camera to measure back the time it takes for the steel ball to drop thought marks on the beaker.
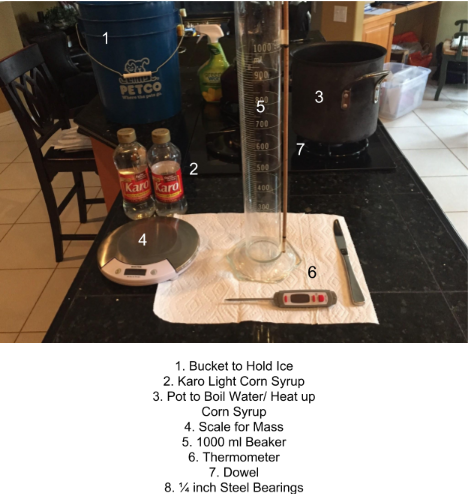
Variable .:. Top
Control: The controlled variable of the experiment include the corn syrup, the amount of fluid in the beaker, and the distance in which the steel bearing dropped
Independent: My independent variable is the temperature in which the corn syrup is.
Dependant: My dependant variable is the time it takes for the steel ball to fall, which then would affect the velocity, which would then be used to measure the viscosity of the fluid. Viscosity can be measured with the formula: (2 x (ball density - liquid density) x g x a^2) / (9 x v)
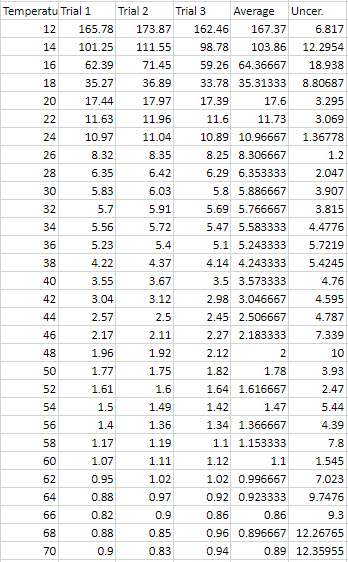
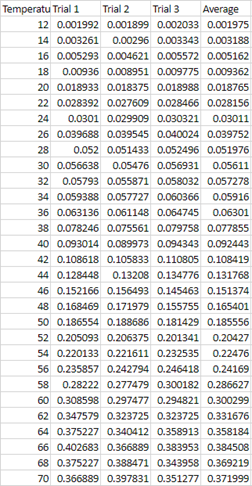
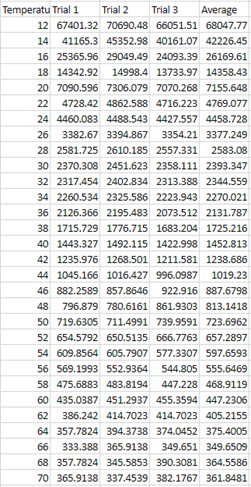
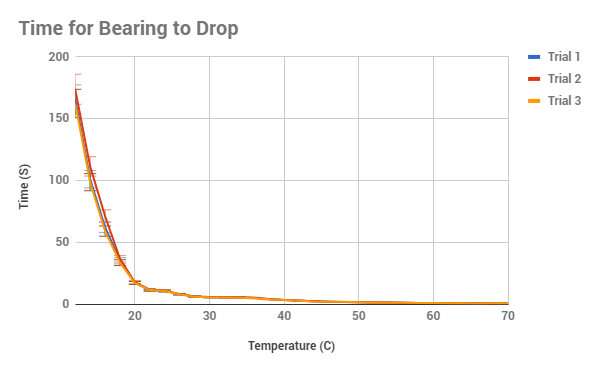
Raw Data .:. Top Time it took for a ¼ inch steel bearing to fall though syrup (Uncertainty = (max time - min time) / average total time * 100%)
Calculations .:. Top
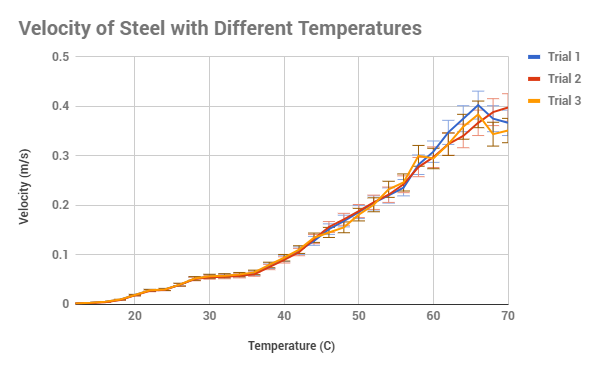
1. Velocity=(0.3302m/t)
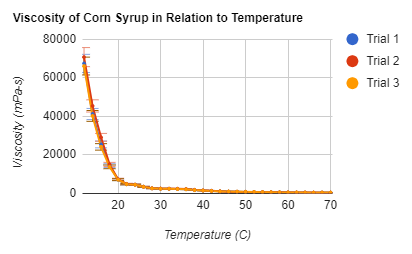
2. Viscosity=(2 x (932.374 -1365) x (9.81) x (.635^2) / (9 x V)
Graphs .:. Top
|
|
Conclusion .:. Top
After analyzing the data from the experiment, it can clearly be seen that my
hypothesis that as the temperature of corn syrup increased, the viscosity would
also increase was correct. What I didn’t expect from the corn syrup was for it
follow the line of an exponential decay, as can be seen in figure 3. A way to
explain this could possibly be that the viscosity followed an inverse Newton’s
law of cooling, where as the temperature increased, the viscosity would be
decrease slower and slower. That, or it is an inherited quality of corn syrup
and other sugar-like products that would need further testing to solve and
figure out. Overall, the data of all 3 trials are extremely similar, with the
lowest calculated uncertainty in the time being 1.2% and the highest being
12.359%, usually with the biggest amounts of uncertainty at the 65 C and up
along with the temperatures 16 C and below. This could be described as one of
our potential limitations, for as the beakers was taken out of the source of
heat/cool, the circulation might have not created an equal temperature on the
surface and the bottom, meaning two different temperatures. Another potential
error could have been that as the sugar in the syrup cooled from high
temperatures, the surface become a thin crust which had to be stirred out each
time, however I did try to prevent this, it could be the reason for just high
variation in figure 2, in which the velocity at 68 C varies dramatically.
Related
Sites .:. Top
http://www.rheosense.com/what-is-viscosity : Learn what viscosity is and how it applies to the real world
http://www.chemengonline.com/viscosity-the-basics/?printmode=1 : Lean what and how to calculate viscosity.
https://wiki.anton-paar.com/en/aviation-fuels/ : Learned what aviation fuel acted like at different temperatures and its basic application in terms of viscosity.
www.teachengineering.org/activities/view/cub_surg_lesson03_activity1. : Lean how to calculate viscosity of oils.
Bibliography .:. Top
RheoSense, Inc. “What Is Viscosity? Why Is It Important for Fluids Characterization?”Viscometers, www.rheosense.com/what-is-viscosity
Engineering, Chemical. “Viscosity: The Basics - Chemical Engineering.” Chemical Engineering Viscosity The Basics Comments, Chemical Engineering, 10 Mar. 2016, www.chemengonline.com/viscosity-the-basics/?printmode=1.
“Aviation Fuels.” Aviation Fuel and Jet Fuel – Viscosity Table and Viscosity Chart, 5 July 2017, www.viscopedia.com/viscosity-tables/substances/aviation-fuels/.
“Measuring Viscosity - Activity.” Www.teachengineering.org, www.teachengineering.org/activities/view/cub_surg_lesson03_activity1.