The Effect of Tube Length and Viscosity on Flow Rate
By: Nicole LaTourette, Shvetank Prakash, Oliver Price
2. Problem
3. Hypothesis
4. Setup/Method
5. Safety and Ethical Considerations
6. Diagram
7. Data and Graphs 1 ( Time it takes to fill 24mL)
8. Data and Graphs 2 ( Flow Rate (mL/s)
9. Conclusion
10. Bibliography
11. Related Websites
Background Information: .:. Top
It may seem that flow rate is a trivial aspect of science as it is not something that one notes or observes on a regular basis; however, people encounter instruments every day that are very applicable to flow rate and incorporate it such as a faucet, shower head, bath tub, hose, etc. Don’t you just hate it when the water takes forever to come out of the drinking fountain? Well that’s all related to flow rate. Similarly, flow rate is very important in the medical field when giving patients anesthetics. Flow rate is defined as, ““the measure of the volume of a fluid passing a point in the system per unit time” (Engineers Edge). Moreover, the physics of flow can be separated into two types: laminar and turbulent. “A number of different physical characteristics determine whether a fluid obeys the principles of one or the other” (Clements and Gwinnutt). Laminar flow is what we generally encounter as it occurs when a liquid flows through a tube and the velocity is somewhat low (Clements and Gwinnutt). On the other hand, turbulent flow happens at a higher velocity and the molecules are more disordered (Clements and Gwinnutt).
Furthermore, there are various factors that can affect flow rate including the viscosity, density, and velocity of the fluid as well as, the length, diameter, and internal roughness of the pipe. In particular we will focus on the viscosity of the fluid flowing through the pipe and the length of the pipe itself. “Viscosity is a measure of a fluid's resistance to flow. It describes the internal friction of a moving fluid” (Princeton University). More specifically, “Viscosity exists in both liquids and gases, and is essentially a frictional force between adjacent layers of fluid as the layers move past one another. In liquids, viscosity is due to the electrical cohesive forces between the molecules” (Giancoli). Understanding the basic relationship between viscosity and temperature is helpful in understanding viscosity. As the temperature of a liquid increases, the viscosity of decreases (Rohde). Likewise, as temperature of the liquid decreases, the viscosity of the liquid decreases (Rohde). For example, as honey is heated, the viscosity decreases and the honey acts as if it was almost thinner.
The purpose of this investigation is to discover how tube length and various viscosities (water, honey/water) effect flow rate.
We believe that the flow rate (mL/s) of a liquid (water, honey/water mixture) in relation to tube length (4 inches, 8 inches, 12 inches, 16 inches, and 20 inches), will continually decrease as the length increases. This will happen because it will take the liquid more time to pass down the tube as the length of the tube increases. We also believe that the flow rate, in relation to viscosity (m^2/s), will decrease as the viscosity increases. Viscosity of a liquid is defined as the measure of resistance to a gradual deformation; in other words it is described as the “thickness” of a liquid. Because of this, as the thickness of a liquid increases, the speed at which it passes down a tube will decrease in speed. The controlled variables include, but are not limited to liquid temperature (room temperature), size of container, diameter of hole will remain constant, and the fluids will all fill up 24 ml in a beaker before we stop the timer.
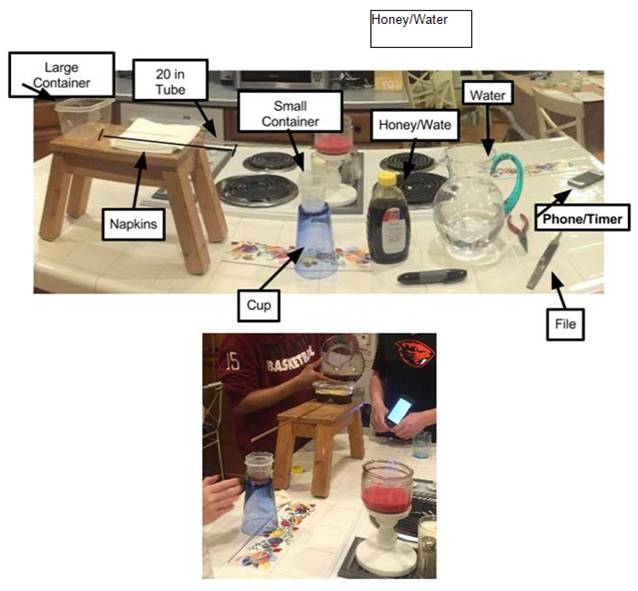
Our setup consisted of a large plastic container, small plastic container, two 20 inch glass tube, metal file, hot glue gun and glue, timer, water, and honey/water mixture. First, the 20 inch glass tube was hot glued to the large plastic container to create a hole for liquid to flow through. The hot glue allowed the tube to be air and water tight around the plastic. The container was then placed on top of a stool on a counter. At the end of the 20 inch tube was a much smaller container marked at 24 mL; this was placed upon an upside down cup in order to get the smaller container closer to the end of the tube and to verify that it was always directly under the tube. Unfortunately, the 20 inch tube had a heavy weight that caused it to slant forward and made the larger container fall forward. To fix this problem, several napkins were placed under the tube to keep the tube and larger container level. We had our set up on a counter to have a better view of the experiment. We had a full pitcher of water accessible during the trials when we were testing the flow rate of water to keep the water at a certain line at all times. This was to maintain a constant pressure. Similar to the pitcher of water, a mixture of honey/water was available as well.
To conduct the experiment, with a phone stopwatch, we calculated the time it took the liquids to flow from the large plastic container to the small plastic container, and stopping the timer when it filled to the 24 mL mark. 5 trials were taken at each tube length. After each length, the metal file was used to shorten the length of the tube. The file was used to make a “divot” into the glass, allowing the tube to break easily and evenly. This was done at every new tube length of 4 inches. Also, a new tube of 20 inches replaced the first 20 inch length tube (now only 4 inches) for the honey/water mixture. This was done to collect the data for the separate liquids all at one time; having both liquids in the same tube would have required cleaning the tube before every trial, which would yield a higher amount of error. This setup was designed to make the experiment more efficient and accurate. We had the container on a stool and on the table made the experiment at eye level, the tube was placed near the bottom of the plastic container to produce higher pressure to push the liquids through the tube, and the napkins were used to level the glass tube. All of this was designed create an experiment that would produce the most accurate data in the most efficient way.
Safety and Ethical Considerations: .:. Top
❖ While conducting the experiment, be cautious around materials, such as: glass tubing, metal file, various liquids, and hot glue as they may cause injuries, such as: cuts, burns, falls, or abrasions.
Time it takes to fill 24mL Data Tables and Graphs: .:.
|
Key: |
|
Water |
|
Honey/Water |
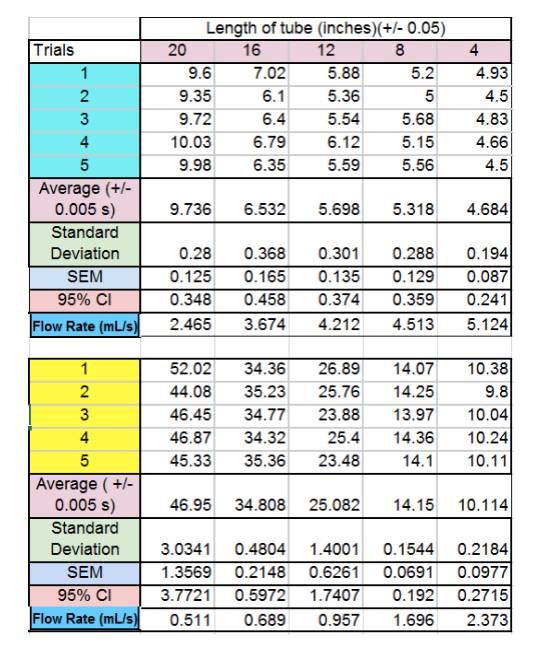
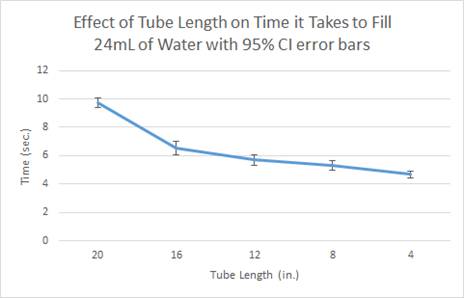
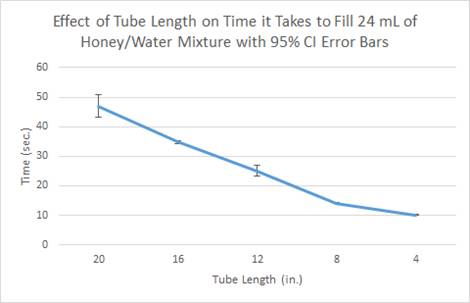
- As shown
through both the data table and graphs, as the tube length decreased, the
time it took to fill the 24 mL of liquid also
decreased.
Flow
Rate (mL/s) Data Tables and Graphs:
.:. Top
|
Key: |
|
Water |
|
Honey/Water |
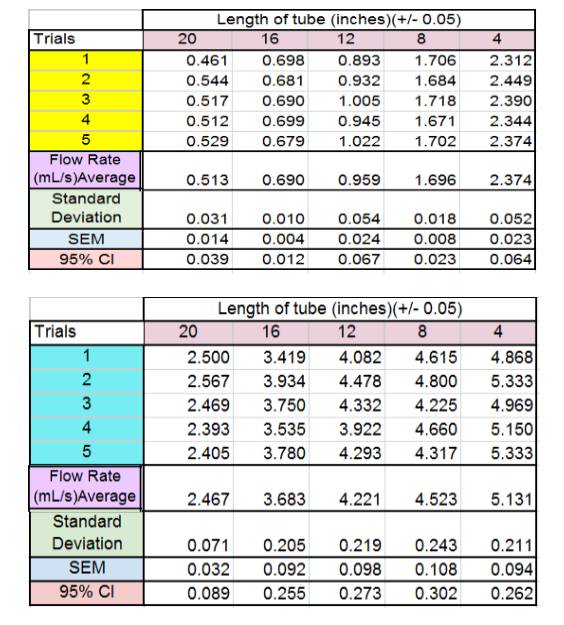
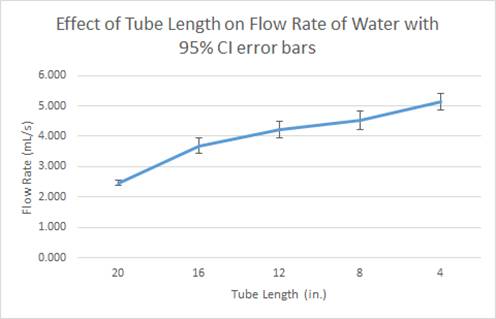
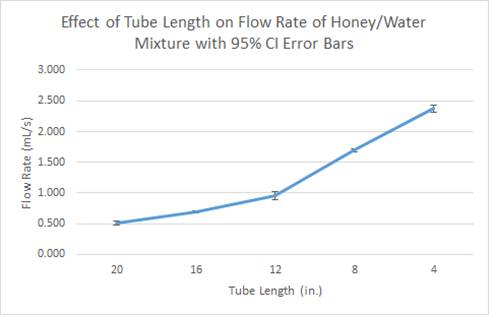
- And as shown
through these data tables and graphs, as the tube length is decreased, the
flow rate of liquid increases.
Our
hypothesis was that the flow rate (mL/s) of a liquid
(water, honey/water mixture) in relation to tube length (4 inches, 8 inches, 12
inches, 16 inches, and 20 inches), will continually decrease as the length
increases. We also believed that the flow rate, in relation to viscosity
(m^2/s), will decrease as the viscosity increases. After concluding our
experiment, we were able to determine that our hypothesis was correct! The data
supported our hypotheses because for the water the average flow rate for for 4 inches was 5.131 ml/s, and for 20 inches it was 2.467
ml/s. For the honey-water, the average flow rate at 4 inches was 2.374 ml/s and
0.513 ml/s for the 20 inch long tube. Thus validating our initial notion that
as you increase the length of the tube the flow rate will decrease.
Furthermore, the average flow rate for each interval of tube length for was
slower for the honey-water mixture than the water. For example, at 8 inches the
water had an average flow rate of 3.683 ml/s while the honey-water mixture had
an average flow rate of 0.690 ml/s. Also at 12 inches, the water had an average
flow rate of 4.221 ml/s while the honey-water mixture had an average flow rate
of 0.959 ml/s. This data proved our hypothesis that flow rate decreases as
viscosity increases correct because the viscosity of water at room temperature
is 1 centipoise while honey’s is 10,000 centipoise. Given that we did mix water with our honey to
make it less viscous, the actual viscosity of our mixture must have been less
than 10,000 centipoise; however, it’s viscosity would
still be greater than the plain water.
In
addition to are raw data, we calculated the 95% CI, which calculated our
percent error. 95% CI means that 95 out of 100 times you will find data in this
range of numbers. For both data tables and graphs, the CI were fairly low,
indicating a low margin of error. This can be seen through the data table and
graph error bars.
As with all experiments, there were some error we made during the lab that
could have changed the outcome of our results, but most of them are too minute
to have drastically skewed our data. For instance, one error we made was that
we used our own eyes to determine when the 24 ml had been full. This was
subject to slight change throughout the experiment because sometimes we’d stop
right at, above, or below the 24 ml mark. This was a flaw in our
experimental design. In order to correct this we’d use an actual graduated
cylinder next time so we could be more precise in our readings rather than
using a tupperware box with a sharpie line on it.
Another source of error came from the person (Shvetank… :/) pouring the water
or honey-water into the container. That person was suppose to pour at a steady
rate to keep constant pressure, but unfortunately that person had shaky hands
and wasn’t always consistent. This was a human error, and if we were to perform
this experiment again we’d have someone else do that job. Ideally, though, we
would want some sort of machine that could pour out at a constant rate to
ensure full accuracy.
We have multiple ideas to make this experiment more exciting and interesting!
If we were to conduct this experiment again in the future, we would do trials using
more liquid with different viscosities: melted chocolate, coffee cream, and
orange juice with pulp. Also, we would try to test temperature to see how it
shifts our results. This would be interesting because warming honey up would
decrease its viscosity but probably not affect water’s viscosity much. However,
this is an additional extrapolation of ours. We’re not exactly sure what adding
temperature as an independent variable would do, but it’s fun to think about
its potential and make this additional hypothesis. Another appealing variation
of our experiment that we could make would be to research turbulent vs laminar flow. This would be a factor that affects
the viscosity, and then the flow rate would be dependent on that change in
viscosity.
Overall,
this experiment was fantastic because although it may not have revealed the
most groundbreaking ideas, it helped us perfect the scientific method and our
enrich our deeper levels of thinking. Moreover, we got a glimpse into what it's
like to be a researcher who has to set up their own lab to solve a problem and
conduct an experiment. Another aspect that was nice was that we got to do it in
the company of our friends so that we were able to bounce ideas off each other
and get another fresh perspective.
Works Cited
Clements, Paul, and Carl Gwinnutt. "The Physics Of Flow." The British Medical Journal 1.2567 (1910): 651-52. Web. 03 Dec. 2015.
"Fluid Volumetric Flow Rate Equation - Engineers Edge." Fluid Volumetric Flow Rate Equation - Engineers Edge. N.p., 2000. Web. 04 Dec. 2015.
Giancoli, Douglas C. Physics: Principles with Applications. Upper Saddle River, NJ: Pearson/Prentice Hall, 2009. Print.
Rohde, Alison. "How Does Changing the Temperature Affect the Viscosity & Surface Tension of a Liquid? | The Classroom | Synonym." How Does Changing the Temperature Affect the Viscosity & Surface Tension of a Liquid? | The Classroom | Synonym. N.p., n.d. Web. 04 Dec. 2015.
"What Is Viscosity." Princeton Education. Princeton University, n.d. Web. 03 Dec. 2015. <https://www.princeton.edu/~gasdyn/Research/T-C_Research_Folder/Viscosity_def.html>.
Related Websites .:. Top
http://classroom.synonym.com/changing-temperature-affect-viscosity-surface-tension-liquid-16797.html
- This website was helpful in learning how temperature affects viscosity and surface tension.
http://www.engineersedge.com/fluid_flow/volumeetric_flow_rate.htm
- This website contained the equation for volumetric flow rate. This was an important equation for our data.
https://www.princeton.edu/~gasdyn/Research/T-C_Research_Folder/Viscosity_def.html
-This taught us the basics of viscosity and was the first website we used. The very basic of our experiment.
http://www.frca.co.uk/Documents/100308%20Physics%20of%20flowLR.pdf
- It was interesting to see different perspective on the procedure of this experiment.
https://www.khanacademy.org/science/physics/fluids/fluid-dynamics/v/fluids-part-7
- Video gives conceptual analysis on volumetric flow rate.
