A Study of the Effects Regular
Changes of Mass induce upon the Terminal Velocity of a Balloon
Also known as,
Look Out Below!
Hershberger, Glenn. Hershberger, Scott
Background
Terminal velocity is where the force exerted by air resistance, which increases with speed, equals the force exerted by gravity. The two opposing forces cause acceleration to stop and limit the speed of an object in freefall.
If there is no air resistance or any opposing force, then velocity between objects of different masses and areas will be equivalent because the only force acting upon them is the force of gravity. This was proved during the Apollo 15 mission by David Scott and Jim Irwin when they dropped a feather and a hammer. They hit the lunar surface at exactly the same time [2]. However, because of air resistance on the earth, terminal velocities will differ along with the objects mass and area.
One can calculate terminal velocity by using the formula: Vt=(2mg/(CA))^1/2, where m=mass, ϱ=air density, g=gravitational field (or for this purpose, 9.81 m/s/s), C= the numerical drag coefficient, and A=area [1]. C tends to vary some with actual shape, but for nearly spherical objects it’s about 0.5. Each object has its own terminal velocity; for example, a 75 kg skydiver with area 0.7 m2 is 60 m/s [1].
Independent variables that can be controlled are mass and area, but gravitational field and C are constants, and therefore cannot be adjusted. In the case of ϱ, it varies with temperature, humidity, and air pressure. The actual formula is ϱ=(Partial pressure of dry air (Pa)/specific gas constant for dry air (287.05 J/(kgK)))+(partial pressure of water vapor (Pa)/specific gas constant for water vapor (461.495 J/(kgK))) [3]. The approximate temperature, humidity, and atmospheric pressure in the physics room, where the experiment will be executed, is respectively 20 degrees C, 50% humidity, and 1013.25 hPa. Therefore, the calculated value for ϱ is 1.1989 kg/m³.
Problem statement
“The purpose is to find the coefficient of drag for a weighted balloon, as well as examine the relationship between the mass of a falling object and its terminal velocity.”
Hypothesis
If the mass of the bottom of a falling balloon is increased, then the terminal velocity will increase in a square root fashion. Also, if the mass is varied, then the C will remain fairly constant.
Materials required:
1 air-filled balloon
5 pennies
1 video camera
1 ladder
5 labeled index cards
2 people (or more)
Logger Pro
1 USB flash drive
Procedure:
In order to test the hypothesis, an air-filled balloon weighted with pennies was dropped from a ladder. The exact method for how to calculate the total area for a balloon wasn’t known, given that it isn’t completely spherical. However, it was reasoned that the part of the balloon that created the most drag would be the widest cross section. If the area of that particular circle were to be found, the approximate amount of drag that the balloon would undergo as it tumbled to the ground could be found as well. The radius would be a crucial part of this. Thus, the circumference of the cross section was found via tape measure, and recorded.
The next step was to find the mass of the balloon with pennies. In keeping with the hypothesis, terminal velocities of the balloon when it had 1, 2, 3, 4, and 5 pennies respectively would be analyzed. Therefore, a triple beam balance was used to find the mass of the balloon when it had one penny, two pennies, and so forth. These masses were recorded respectively.
In order to actually find the terminal velocities, videos of the falling balloon that could be analyzed through Logger Pro would be needed. Therefore, the third step was to set a video camera that Mr. Murray kindly lent us on top of a table, aimed at the site where the experiment would be conducted.
Next, a ladder was positioned in view of the camera. Once that had been done, a valiant soul ascended it, with balloon in hand.
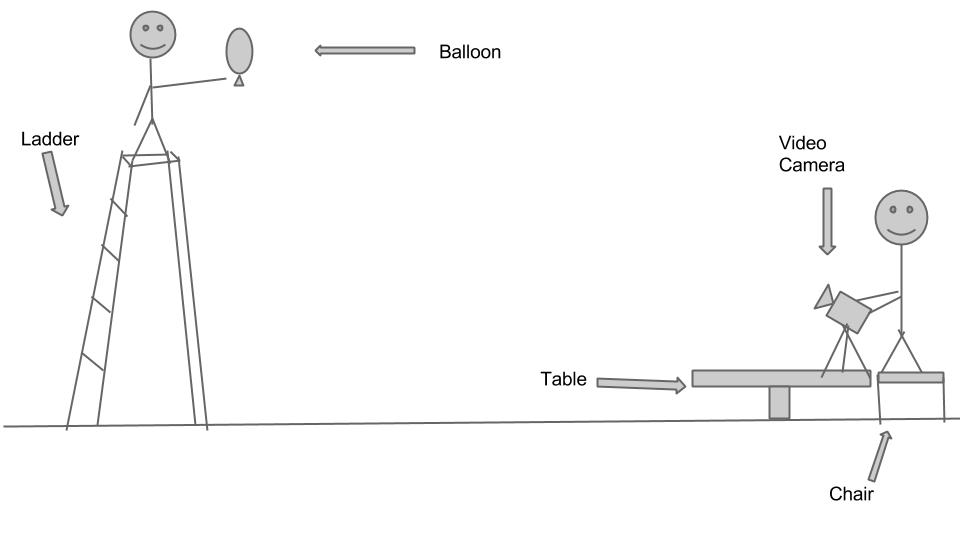
Before the balloon was dropped, an index card that indicated which drop was being conducted was placed in front of the camera. With this label in the video, identifying each drop would be greatly simplified. For the first drop, all five pennies were placed in the neck of the balloon. The index card was then removed, and the person on top of the ladder dropped the balloon. As the balloon hit the ground, the camera operator stopped recording. The camera operator then returned the balloon to the person on top of the ladder, and three more videos were taken in the exact same way as the first. Afterward, a penny was removed, and three new videos were taken. Three videos were also taken for the drops involving 3 pennies, 2 pennies, and 1 penny. Once all sixteen videos were complete, they were uploaded to a USB flash drive, and the camera was returned. The videos were then analyzed in Logger Pro to find terminal velocity.
.jpg)
.jpg)
Data table and Graph: See attached document.
| pennies | 1 | 2 | 3 | 4 | 5 | |
| terminal velocity (m/s) | 1.955 | 2.174 | 2.677 | 3.026 | 3.178 | |
| uncertainty (+/- m/s) | 0.01133 | 0.01084 | 0.01108 | 0.01933 | 0.01877 | |
| terminal velocity (m/s) | 1.821 | 2.153 | 2.645 | 3.039 | 3.312 | |
| uncertainty (+/- m/s) | 0.01323 | 0.00682 | 0.01234 | 0.01715 | 0.02539 | |
| terminal velocity (m/s) | 1.849 | 2.292 | 2.657 | 2.788 | 3.227 | |
| uncertainty (+/- m/s) | 0.00799 | 0.01279 | 0.01006 | 0.01297 | 0.02227 | |
| terminal velocity (m/s) | 3.192 | |||||
| uncertainty (+/- m/s) | 0.01512 | |||||
| average Terminal v (m/s) | 1.875 | 2.206 | 2.660 | 2.951 | 3.227 | |
| uncertainty (+/- m/s) | 0.03259 | 0.0303 | 0.03349 | 0.04923 | 0.08136 | |
| mass (kg +- .00005 kg) | 0.00422 | 0.00688 | 0.00989 | 0.01227 | 0.01471 | |
| area of widest point (m^2) | 0.0347 | 0.0347 | 0.0347 | 0.0347 | 0.0347 | |
| uncertainty (+/- m^2) | 0.00033 | 0.00033 | 0.00033 | 0.00033 | 0.00033 | |
| average | ||||||
| C | 0.5661 | 0.6666 | 0.6594 | 0.6645 | 0.6661 | 0.6445 |
| uncertainty | 0.03177 | 0.02949 | 0.02621 | 0.0312 | 0.04218 | 0.16138 |
Data file: text .:. Excel .:. Browse Data Files
Calculations:
A=![]()
C=![]()
![]()
Summary:
C was fairly constant throughout the number of pennies, except for the 1 penny average, which was about 0.1 lower. Also, the terminal velocity increased with a slightly negative second derivative, causing it to look like a square root graph.
Based on the last part of the results section, the hypotheses about the form of terminal velocity change and about C were both supported.
The 1 penny average’s C was lower because the balloon tumbled more, as it didn’t have as much weight to keep it upright during the fall. Also, the terminal velocity increases with the square of the mass because the drag force increases with the square of the velocity [1], while the gravitational force increases linearly with the mass.
A primary source of error was the lack of an accurate measure of distance. The ladder was adequate, but as it wasn’t 2-dimensional, it was impossible to get a completely accurate measure. If a nearby two meter rod had been used instead, it would have improved the experiment immensely. Another distinct issue was the fact that the balloon’s irregular shape caused it to spin and tumble in midair, thus creating even more drag than would have been created otherwise. A possible remedy for this would have been to use a punch balloon instead of a normal balloon, as punch balloons bear a much more spherical shape than the average helium balloon.
(1.) http://hyperphysics.phy-astr.gsu.edu/hbase/airfri2.html
Nave, R. "Terminal Velocity." Fluid Friction. Georgia State University, n.d. Web. 19 Nov. 2013.
This has the equation for terminal velocity in it.
(2.) http://er.jsc.nasa.gov/seh/feather.html
Woodfill, Jerry. "NASA Lunar Feather Drop Home Page." NASA, 1 Dec. 2005. Web. 19 Nov. 2013.
This discusses the behavior of falling objects with no air resistance.
(3.) http://forecast.weather.gov/MapClick.php?zoneid=ORZ006
"7-Day Zone Forecast for Greater Portland Metro Area." National Weather Service, 19 Nov. 2013. Web. 19 Nov. 2013.
This gave the air's humidity in Portland.
(4.) https://www.brisbanehotairballooning.com.au/faqs/education/116-calculate-air-density.html
Steve Griffin. N.p., n.d. Brisbanehotaireballooning.com. Fly Me to the Moon Hot Air Ballooning. Web. 19 Nov. 2013.
This has calculators for the density of air at a given pressure and humidity.
(5.) http://www.grc.nasa.gov/WWW/k-12/airplane/termv.html
Center, Glenn Research. "Terminal Velocity." Terminal Velocity. NASA, 11
Feb. 2014. Web. 27 May 2014. <http://www.grc.nasa.gov/WWW/k-12/airplane/termv.html>.
This has further details about terminal velocity.