Changes in Rotational Velocity of an Electric Motor with Respect to Voltage
Conor Somervell, 2013
Background Information: Back to Top
The most famous and commonly used motor is the combustion engine, which was the backbone of Industrial-era production for the past few centuries. However, recently, independent science teams like Mythbusters and WeatherImagery claim that the newer electric motors are stronger and more efficient than their combustion predecessors. Rather than relying on heated steam pressure, electric motors rely on the natural properties of electromagnetic induction and magnetic flux in order to work.
The British scientist Michael Faraday was the first to experiment with the conversion of electrical energy to mechanical energy in 1821. His theses about magnetic flux and its relation to electric currents are the backbone of the construction of the electric motor. The engine’s rotor, shaped like a circle, uses the properties of electromagnetic induction described by Faraday to exert a force on each end closest to the magnets on either side, thus forcing the motor to rotate.
Electric motors function by sending electric currents along a coil of wire, across a magnetic field. The magnetic field exerts torque on the coil and forces it to spin, thereby converting the circuit’s electric energy into mechanical energy, which can be harnessed to run turbines, propellers, pumps or engines, for example.
As the number of possible experiments involving electric motors was tremendous and required more resources than were available, I decided to measure how the rotational frequency of the Tualatin High School Physics Department’s 9- and 20-volt electric motors were affected by voltage. To simplify calculations and reduce the amount of independent variables involved, both of the electric motors run on direct current, not alternating current.
Statement of the problem: Back to Top
The purpose of this investigation is to determine the relation between applied voltage and the rotational frequency of two electromagnetic motors of various voltage ratings.
Ohm’s law states that the current of a circuit is equal to the voltage divided by the resistance. Assuming a constant resistance of the motors, I predict that the graph of the data (with voltage as the independent variable and frequency as the dependent variable) will be linear.
Materials:
(1) Vernier Photogate
(1) Vernier LabPro Interface
(1) TKK Mabuchi classroom electric motor, model RS-555PH DC Motor (9-Volt)
(1) Mabuchi classroom electric motor, model RS-555PH DC Motor (20-Volt)
Duct Tape
Dental Floss
(1) Paperclip, small
(1) Variable Power Output
(1) Voltmeter with respective wires
(2) Alligator Leads, for use with the power source
A computer, with Vernier Logger Pro installed
 We
will begin by using the 9-volt classroom motor, before progressing to
the 20-volt motor.
We
will begin by using the 9-volt classroom motor, before progressing to
the 20-volt motor.
9-volt motor
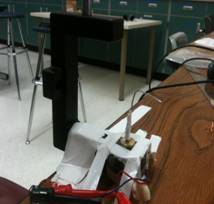
Firstly, we must secure the 9-volt motor to the table using the duct tape. Apply so as to firmly attach the motor to the surface and reduce the motor’s side-to-side motion. The small paperclip is extended, cut in half, and bent at a 90-degree angle. Then, attach it to the central rotor of the motor (the metal rod extending from the top) using duct tape and the dental floss (note: the dental floss is used to keep the paperclip rigid and to reduce its bend outwards during high rotational speeds). See Figure A (right) for elaboration.
As the motor will be spinning too fast for cameras and most measurement devices to recognize, we will be using the Vernier PhotoGate device. The PhotoGate has a vertical sensor, which can be used to measure the intervals between revolutions, every time the paperclip passes through the sensor. Now, properly attach the PhotoGate to the LabPro, which is hooked up to the computer (this allows for the computer to recognize the data inputted by the PhotoGate).
Under the “Experiment” Tab, select “Devices”; this brings up a menu of the devices attached to the LabPro. Click on the input labeled with the PhotoGate, and select Pulse Time as the collection data.
Then, connect the power source to the motor’s wires, making sure to attach the black alligator clips to the black motor wire, and the red clip to the red wire. Afterwards, hook up the voltmeter to the motor, with the black cable attaching to the black wire and the red cable to the red wire. Make sure that the voltmeter is set to read 20 Volts, as this is the volt scale we will be using for the power source later.
When everything is secured and connected, turn on the power source, setting the red knob in the middle to read 20V DC Output. Then, gently increase the voltage by using the left-most knob until you get to .5 Volts. (Note: The motor will not begin to spin until about .4 volts is supplied) For the smaller motor, we will be collecting data from .5 Volts to 5.0 Volts, using .5-volt intervals.
When the motor is moving at a constant speed, press “Collect” – the green button in the top-right of the screen. Let the logger record data for 5 – 10 seconds before pressing “Stop”. Go to “Analyze” à “Statistics” and highlight the data. Record the pulse time as the “mean” given by the statistics. Continue this process, increasing the voltage by .5 volts each time, until you reach 5 volts.
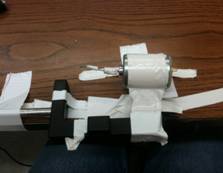
After all the data is collected for the smaller motor, run the process again using the larger 20-Volt motor. The 20-volt motor may have to be hooked up horizontally, rather than vertically, like the small motor. If this is the case, check to see that the paperclip will not come in contact with the table or the PhotoGate when rotating at high speeds. See Figure B (left) for a horizontal setup of the 20V motor.
Just as before, use LoggerPro to calculate the mean pulse time of the 20V Motor. However, this time, take data for 10 Volts, increasing by .5V intervals.
Lastly, to calculate the frequency (revolutions per second) of the motors, take the inverse of the pulse time (seconds per revolution). Do this for each voltage.
Small Motor Data
|
Potential (Volts) |
Frequency (rev/s) |
Pulse Time (s/rev) |
|
1.046 |
16.700 |
0.05988 |
|
1.489 |
24.462 |
0.04088 |
|
2.060 |
34.710 |
0.02881 |
|
2.481 |
41.701 |
0.02398 |
|
3.044 |
51.125 |
0.01956 |
|
3.504 |
58.445 |
0.01711 |
|
4.056 |
66.667 |
0.01500 |
|
4.495 |
72.569 |
0.01378 |
|
5.016 |
75.873 |
0.01318 |
|
5.503 |
80.710 |
0.01239 |
Large Motor Data
|
Potential (Volts) |
Frequency (rev/s) |
Pulse Time (s/rev) |
|
0.3128 |
18.474 |
0.05413 |
|
0.4307 |
30.066 |
0.03326 |
|
0.5228 |
37.636 |
0.02657 |
|
0.5625 |
47.506 |
0.02105 |
|
0.6487 |
50.429 |
0.01983 |
|
0.7220 |
58.893 |
0.01698 |
|
0.7725 |
68.213 |
0.01466 |
|
0.8186 |
77.942 |
0.01283 |
|
0.8504 |
87.489 |
0.01143 |
|
1.001 |
95.785 |
0.01044 |
The results of the experiment showed that the available maximum rotational frequency of the 9-volt electric motor was just under 90 revolutions per second, while the maximum rotational frequency of the 20-volt motor was just under 100 revolutions per second. However, the 20V motor was able to withstand a higher voltage (10 Volts) before becoming too unstable and vibrating the setup. Also, the trend lines of both of the graphs appeared to be polynomial, rather than linear as I had predicted; the 9V graph was a negative polynomial function, while the 20V graph, while more irregular in its data points, was a positive polynomial function.
Because of this, my hypothesis was wrong; my theory that the frequency would increase linearly relative to the voltage was proven false. This does not conform to what I had thought with Ohm’s law, which means that the resistance of the circuit must have been increasing alongside the voltage in the 9V motor, and inversely in the 20V motor.
What I found most peculiar about these results was that the increasing exponential trend line seen in the 20V graph. The 9V motor was beginning to increase more slowly once it was nearing half of its potential voltage (at around 4 – 4.5 volts), while the 20V motor kept increasing faster at 10V. Perhaps, had I experimented with higher voltages, the 20V motor’s frequency would have begun to even out at around 15-18 volts, as it approached its limit.
Insofar as why my hypothesis was wrong, I theorize that the magnetic forces acting on the rotor could have contributed to some resistance, and increased slightly alongside the increase in electric current. Doing some post-experimental research, I learned that there are some certain types of DC motors that have two sets of magnets; the first being the regular, static magnets used to generate the primary magnetic field, located on the stator, while there was a second set that is used on the rotor of the magnet to allow for a continuous magnetic force. Basic electric motors only have the stator magnetic fields. In the future, I would dissect one of the motors after experimentation to determine if it had rotary magnets, and determine (using stator-only magnets as my control) the effects of the rotary magnets on the acceleration of an electric motor with respect to voltage.
There were a few errors in this experiment. Firstly, the way that it was set up was not able to be completely stable at higher voltages; the motor began to shake and rattle much sooner than had been expected. Secondly, it was possible that the air resistance was part of the reason why the 9V motor began to decrease in acceleration at higher speeds. Lastly, there may have been some error in the Vernier PhotoGate itself, as I do not know the limits of its accuracy; it may not be able to recognize the passing of the paperclip if the motor was spinning too fast.
In order to solve these errors, a future addition would be to perhaps lodge the motors in place by drilling cylindrical holes the size of a motor into a block of wood, to reduce the rattling of the motors. I suppose that if we wanted this experiment to have as little error as possible, it could be conducted in a small vacuum chamber, to eliminate air resistance. The final error, the PhotoGate’s potential inaccuracy at high speeds, may be fixed by getting the newest Vernier rotational sensor.
"Electric vs. Gasoline Motors." WeatherImagery RSS. N.p., n.d. Web. 18 Jan. 2013.
This website explains the differences between gasoline motors and electric motors, like the one that I used.
Hyneman, Jamie. "MythBuster: Why Electric Vehicles Beat Gas in 5 Extreme Tests." Popular Mechanics. Hearst Communication, Inc., 19 May 2008. Web. 18 Jan. 2013.
A summary of the Mythbuster Jamie Hyneman explaining how they ran tests on a larger-scale electric motor on an automobile.
Nave, Carl R. "Faraday's Law." Faraday's Law. C. R. Nave, 2012. Web. 18 Jan. 2013.
This is an educational website that effectively explains how Faraday's Law and the properties of electromagnetism allow for an electric motor to function
Sadiku, M. N. O. (2007). “Elements of Electromagnetics” (fourth ed.). New York (USA)/Oxford (UK): Oxford University Press. p. 386.
This is an educational text which covers information about electromagnetism from a collegiate text book.
Garrison, Ervan G., "A history of engineering and technology". CRC Press, 1999.
Similar to the Sadiku text above, this explains how the properties of electromagnetism can be applied to engineering problems.