|
Materials:
*1000 watt microwave oven
*24 1/4 inch corrugated cardboard 6x6 inch squares
*250 6x6 inch sheets of fax paper (to create purchase AT&T High Sensitivity Fax Paper-SKU#190-305)
*Computer complete with Excelã
*1/4 inch graph paper imposed onto a transparency
*Access to a copy machine
*Ruler
*Paper cutter
*Rectangular glass dish (2 inches deep)
*Water
Procedure:
1. First it is necessary that you cut all of the cardboard and fax paper in advance. This will take approximately 5 hours if you take advantage of a paper cutter. These items are numbered and marked for orientation.
2. Also, mark a 6x6 inch square on the bottom of the microwave. The reason for this size is that the diagonal of the square will then be the diameter of the platter.
3. Fill the glass dish with water, and soak the cardboard squares within this for 10 minutes. If you do this enough friction will occur so that the squares do not move.
4. Experiment with 2 second increments to calculate the amount of time necessary for each level. For a 1000 watt microwave, this should be 4 seconds for levels one through eight, and 12 seconds for levels nine through 24.
5. Now that you are ready to begin, float the fax paper (shiny side up) in the dish. Before the water soaks through, remove the paper and lay it on top of a piece of cardboard.
6. Close the microwave door, and heat for the appropriate amount of time, which was figured in step 4.
7. Repeat steps 5 and 6 for trial two for each level.
8. Now that two trials have been done on the first level, add a sheet of cardboard on top of the one that is already inside the microwave, and repeat steps 5, 6, and 7. Continue until you are at level twenty-four.
9. To prove that there is a distinct pattern, it is also helpful to heat the fax paper at all levels at the same time. Because of the increased mass, 14 seconds is needed to heat the entire set-up.
10. Allow 30 minutes for all of the data to dry. The heat distribution, which is indicated by black areas will still remain after the sheets have dried.
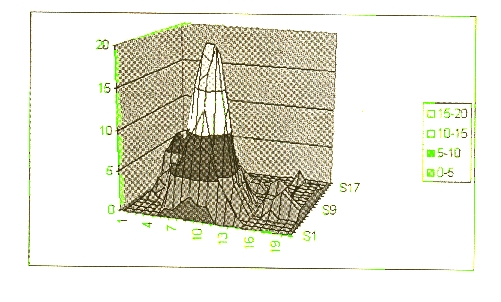
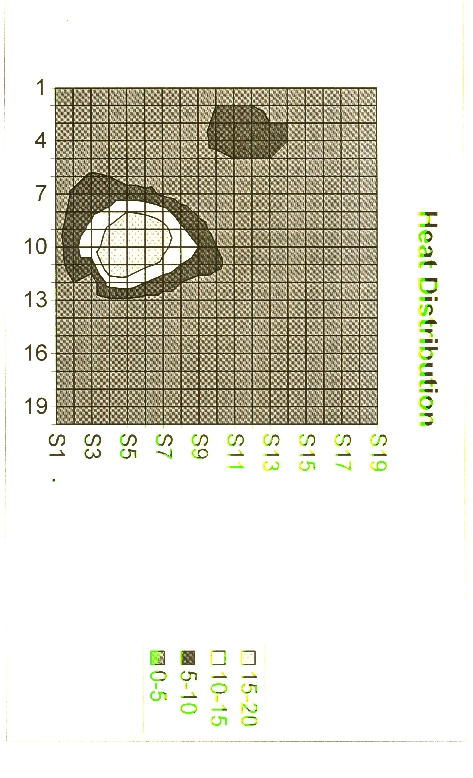
The results of this experiment show a distinct pattern of heat distribution. This is illustrated in Figures 4-27 which are simply copies of trial one and two, for each level, side by side. What appears is similar patterns, and this suggests that the waves are standing. Because of this I knew that it would not be difficult to graph the heat distribution. What was done, is that the transparency (with graph paper on it) was placed above each sheet. Wherever a dark spot appeared a pin hole was made. This was done for every level, and each hole was assigned a value of one. Once the totals were calculated, Excel was then used. After entering the data into a spreadsheet (Figure 1), a surface graph was created. This is Figure 2, and the heat trends are shown. Similarly, an elevation graph was created. This appears as Figure 3, and essentially it shows that more hot spots occur within the center of the microwave.
This evidence supports the hypothesis that I made, but to show that this was the reason that turntables were used I also heated a sheet with the turntable still in the microwave. The results are Figure 4 which is an almost solid black sheet. Although this would suggest even heat distribution, it is important to note that the exact amount of heat distributed at each point is unknown. Also, I find it interesting that there is the image of a circle. This, I believe is the hotspots(see level one data) rotated.
Because in every trial, similar patterns appeared at each level, it seems logical to conclude that these spots will be hotter every time the microwave is used without a turn table. In this way, this experiment shows that at least Kenmore microwaves contain standing waves, and that their collision therefore causes uneven heat distribution to occur.
|