IB Extended
Essay...
A Study on the Effects,
Variance, and Correlation of Data Obtained From the
Off-Center Strikes of a Golf Ball on a Club
By: Kyle Peyton
Index
Sections
- Background Information
- Methods
- Results
- Discussion
- Extension
- Bibliography
Background Information
Object A, in motion, crashes squarely into object B,
stationary. As a result of this collision, object B will be
set in motion on a set path. Assuming both objects are
resting on the level ground, object B will be set on a
straight path, leading away from object A. This is a fairly
easy concept to understand. However, if object B is not
struck squarely by object A, what will be the subsequent
results of the collision? Let’s assume that object A is
a golf putter, and that object B is a golf ball. If the
putter is swung directly back and directly forward from the
ball, striking it directly in the middle of the club face,
the ball should take off in a line perpendicular to the club
face. But if the ball is not struck directly in the center of
the club face, deviating up to ½” from the center, what
path will the ball take on? Will it shorten the length of the
putt, extend the length of the putt, make the putt veer
right, or make the putt veer left? Each of these
circumstances will be investigated in this paper and
hopefully a conclusion can be made about the consequences of
an off-center putt.
Weighting is an important part of this experiment. Not all
putters are designed the same. Some are designed with the
shaft connecting to the club head at the heel, and some at in
the center. Most putters have the shaft connected with the
heel of the club head, so that is the style that will be
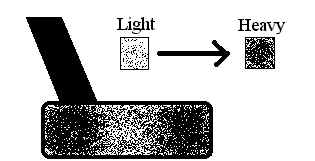
used. The more meaningful aspect of this test is the
distribution of the weight throughout the putter head. A
putter that carries most of its weight at the ends will
strike the ball more solidly and not rotate wildly on
off-center putts, because its moment of inertia is larger.
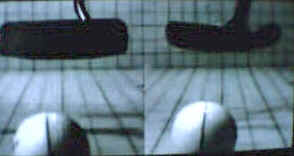
Many putter manufacturing companies have realized this, such
as Carbite Golf. “Carbite Polar Balanced Putters have
moved 90% of the effective putter-head weight to the toe and
heel” (Carbite). Makers of Carbite putters tell us that
“this technology reduces club head rotation at impact,
even on off-center hits, meaning that your putter stays
square at impact and that more of your puts stay
online.” The picture below is of a demonstration
performed by Carbite in an attempt to show that a Carbite
putter (left) will twist less when struck on the toe than a
Titleist putter (right).
A putter containing most of its weight at the center of
the club head will rotate more easily, since its moment of
inertia is much smaller. This factor alone contributes to
much of the twisting involved in miss-hit putts. In addition
to weight distribution, overall weight is also a huge factor
in determining the severity of off-center putts. A putter
which weighs quite a bit will not rotate much when it strikes
a golf ball on the heel or toe, whether or not the weight of
the putter is concentrated on the toe and heel.
Dwell time is also another significant factor in
determining the accuracy of a putt. Dwell time is simply the
“amount of time a golf ball remains in contact with the
surface of the putter” (Fisher). The longer the dwell
time, the straighter and more consistent the putt should be.
A putter with a softer face should have a longer dwell time
and a putter with a more solid face should have a shorter
dwell time. It is preferable to have a putter with a softer
face.
The mechanics of a putt are different for each person.
Although there is thought to be an ideal form for putting,
each player develops their own personal technique and
attempts to master it. But although techniques may vary, no
player always strikes the ball with the center of the putter
face. Everyone deviates from the center, whether it be toward
the toe or toward the heel. When a ball is struck near the
toe of a putter, the toe portion of the putter should rotate
backward just slightly, causing the club to angle right a
little. This fact leads me to believe and hypothesize that
the ball will be projected right of the target line on toe
collisions. On the contrary, when a ball is struck nearer to
the heel of the club, the club head should angle to the left
slightly. Therefore, I hypothesize that a ball struck on the
heel of the club will produce a putt which is aimed left of
the target line. Also, in reference to distance, my
hypothesis is: When a golf ball is struck off-center, the
resulting distance that a golf ball will travel is much less
than if the ball were struck solidly in the center of the
club. The energy which is put into rotating the club when the
ball is struck off-center will be taken away from the kinetic
energy of the ball.
Method
The primary step in carrying out this study was to
identify the goal of the experiment and to design a working
setup which would be used in the experiment. The most
mentally exhausting part of the study was designing a working
setup which would swing a Spalding putter similar to a human
swing. I did not want to design a setup that would swing the
club straight back and straight forward, because that is not
like a human swing. A human swing takes the club back in an
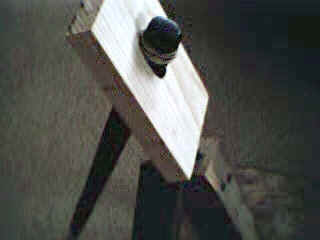
upward, rotating arc. Therefore, I created a tripod which
would be able to support the weight of the putter. Then, I
came up with the idea of setting the putter inside a hole
which was bored into a piece of wood. The wood was designed
to be slid over a nail, and then later the rest of the nail
would be slid into one of the legs of the tripod. Once the
complete setup was assembled, I slid the putter into the hole
in the wood and wrapped a rubberband around the end of it to
keep it from falling out. I found out later that the rubber
band provided an impressively realistic comparison to a human
hand's grip.
Next, I constructed a guideline which was suspended in the
air above the putter head from an object behind the setup to
another object directly down the target line. This guideline
served as something to measure left-right deviation from.
Also, since the guideline was suspended over the putter, it
didn't affect its swing at all.
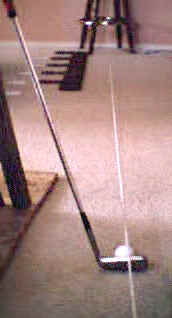
In order to measure the distance that the balls traveled
when hit, I had to create a measuring system. My measuring
system consisted of placing small sticks at intervals of 2
inches. Then, I placed slips of paper next to the sticks
every foot that noted the distance.
Now I must address the problem of bringing the putter's
backswing to the exact same spot each time it was swung. A
box was placed at a certain point behind the setup where if
the putter were taken back, it would stop after reaching the
altitude of 7 inches. Also, another box was placed parallel
to the toe of the putter so that if the putter was twisted, I
could line it back up perpendicular to the target.
Testing my hypothesis was quite time consuming. In order
to test it I had to take 20 data points in 5 different places
on the putter. Twenty swings and data points were taken for
balls struck on the heel of the putter, semi-heel of the
putter, center of the putter, semi-toe of the putter, and toe
of the putter. The left-right deviation was measured and
paired with its length. All data was recorded and then later
entered into the computer.

Results
Data
File
Data File
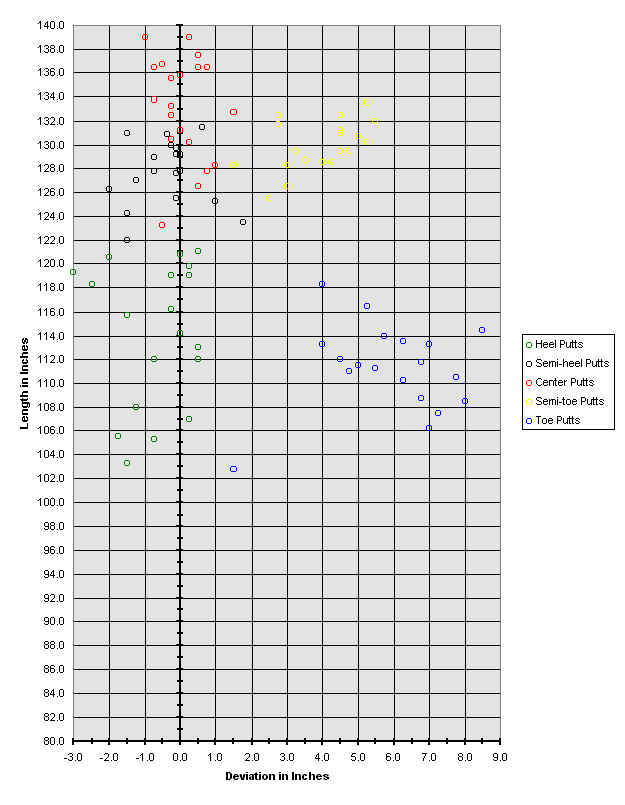
The above chart is a plot of all data taken.
Each circle represents one trial. The different colors
correspond to different places on the putter face where the
ball was struck.
Discussion
The purpose of this study was to design and
use a setup, producing data from heel and toe putts, that
would fairly accurately imitate a human golf swing.
Obviously, results would vary upon the type of putter being
used, but a consistent set of points was collected from this
Spalding putter. By studying the graph of the points, I have
noticed a few trends among the different sets.
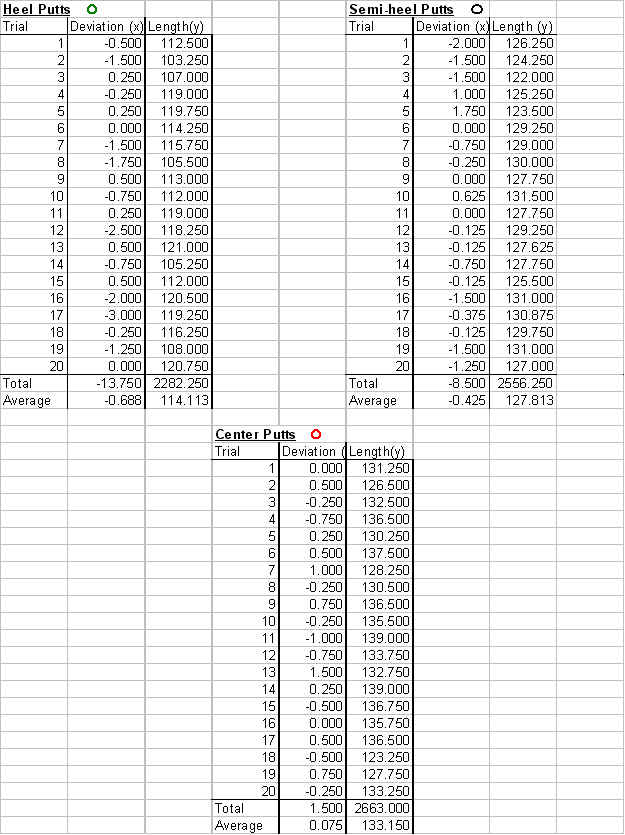
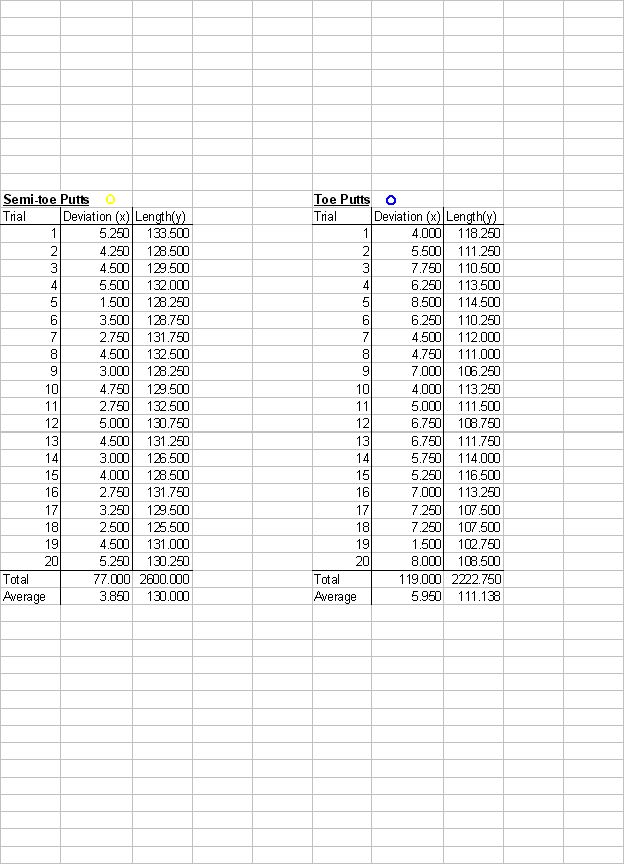
There are 5 sets of data created by hitting
the ball on 5 different parts of the putter face; heel,
semi-heel, center, semi-toe, and toe. For the sake of brevity
I will refer to each of the sets as green, black, red,
yellow, blue accordingly. The green set, being struck on the
heel of the club, produced a weak set of points, lacking in
length and accuracy. I've determined that this is mainly a
result of a putter with a poor moment of inertia.
However, the green set's average deviation of
-.688 inches is hardly comparable to the blue set's average
deviation of 5.95 inches. This abnormality leads me to
question why it is that these two extremes aren't equally
opposite. My conclusion is that a putt struck on the heel of
the club, although not in the center sweet spot of the
putter, still possesses extra momentum which is gained from
the shaft of the club. The shaft of the club not only serves
as a mode of transportation for the head, but also as a
reinforce to the heel of the head. On the contrary, the toe
of the head does not have the luxury of extra reinforcement
from the shaft, so it rotates more and results in a shorter
and more deviate putt. This can be seen by noticing that heel
putts averaged 114.113 inches in length, while toe putts
averaged 111.138 inches in length.
Another interesting find concerns the
relationship between the extremes (heel and toe putts) and
the semi-extremes (semi-heel and semi-toe putts). The average
putt for a heel strike resulted in a deviation of -.688
inches. The average putt for a semi-heel strike resulted in a
deviation of -.425 inches. By simply dividing -.425 by -.688,
I came up with about 62%. This number, in and of itself,
means nothing. However, if compared to the percent found by
dividing 3.85 (the average deviation of a semi-toe putt) by
5.95 (the average deviation of a toe putt), I got
approximately 64%! These two percentages, 62% and 64% are
practically the same. This correlation leads me to believe
that although the two extremes (heel and toe putts) aren't
directly related concerning deviation, the relationship
between the extreme and it's lesser is a constant. This means
that as a ball is struck closer and closer to the center of
the putter, the rate at which it deviates from straight is
uniform on both ends of the putter.
In addition to the previous find, I also
discovered that the relationship in length of extreme putts
(heel and toe) and the semi-extreme putts acts in a similar
way. In order to show this I had to look at the average
distance of a heel putt compared to the average distance of a
semi-heel putt. The percentage came out to be approximately
88%. Similarly, the percentage attained by dividing the
average length of a toe putt by the average length of a
semi-toe putt comes out to be 86%. Once again, there exists a
direct correlation between the decrease in length of heeled
putts and the decrease in length of toed putts.
By combining the correlation of deviation
with the correlation of length, I have determined that
decrease in length and inaccuracy is similar on both ends of
the putter. Although they may not be the same numbers, the
rate at which they decrease is almost exactly the same.
All of the relationships that I found in the
results, because of the inaccurate data, are just estimates.
None of them can be pinpointed as being precisely right
because there was such a range in the data found. For
instance, the heel putts, semi-heel putts, and center putts,
all seem to blur together if they are placed on the same
graph. The only thing that differentiates between each of
those three sets of data is the change in color which I
created in the graph. The overlap between the 5 sets of data
can best be seen if the graph on page 10 is observed. For
example, the range in the heel putts for accuracy deviation
is 3.5 inches, while the range for distance is 17.75 inches.
The range for semi-heel putts is similarly 3.75 inches in
deviation and 9.5 inches in distance. The huge spread of the
points leads me to believe that any conclusions made about
the results of the experiment can't be totally trusted or
relied upon.
Extension
In addition to the correlations found in the
previous part of this study, a broader and more in-depth
analysis is yet to come. As can be seen in the graph of the
individual trials, there exists some sort of relationship
between where the ball was struck on the club face and where
the ball ended up on the grid. The heel putts tended to be
shorter and left of the target line, the semi-hell putts
tended to be slightly further and slightly less off center to
the left, the center putts were generally accurate with
optimal distance, the semi- toe putts tended to veer right
and come up short of the center putts, and the toe putts
tended to be the furthest right, coming up short of almost
all other putts. This data, when graphed, produces a sort of
arc which resembles a parabolic curve.

Seeing this curve, I noticed that a function
could possibly be set to match these points as accurately as
possible. First, in order to eliminate any sort of problems
there might be in interpreting the data, I found the average
putt for each of the 5 positions where the ball was struck on
the putter. These values can be seen on pages 8 and 9 at the
bottom of each table. By entering these data points into a
calculator and instructing it to calculate the linear
regression of the 5 points, a formula was obtained. This
formula takes the form: y = -2.032424x² + 9.038215x +
128.088049, where x is the deviation of the putt and y is the
length of the putt. Although this formula may not represent
the undebatable perfect fit to the data, it does give a very
good estimation. As seen on the next page, the line fits each
of the points fairly well, except for the heel putts. The
heel putts tend to be less deviate and greater in length than
the formula predicts. This difference in prediction and
reality can be attributed to the physical reinforcement that
the heel of the putter receives from the shaft of the putter.
Also, since the toe of the putter does not receive support
from the shaft of the club, it tends to flex more, decreasing
the kinetic energy of the ball and directing it on a less
accurate course. Therefore, the graph isn't a perfect
parabolic curve because the shaft of the putter influences
the off center putts. Although the curve of the data isn't
perfectly parabolic, the line fits quite well. By using this
formula, a fairly accurate prediction of a putt's length and
deviation can be made for off center hits. This formula is
helpful because of the capability it has to predict where a
putt will end up as a result of an off center hit. However,
the formula can't be used to predict the exact place where
the ball will end up, because of the range in data which was
used to create the formula.
There also exists a relationship between
where the ball was struck on the face of the club and how far
the ball deviated from straight. To begin with, it is
apparent that the center putts, on the average, were almost
exactly straight. So I can use the set of center putts as a
control group. I also measured the distance between the
points where the balls were struck on the club face and found
it to be 11/16 inches. Therefore, the point furthest towards
the heel of the club is 22/16 inches away from the center.
The relationship between where the ball was struck on the
heel of the club face and what the average deviation for heel
putts is -.688/(-22/16) = .5. Then, the relationship between
where the ball was struck on semi-heel of the club face and
what the average deviation for heel putts is -.425/(-11/16) =
.62. The significant difference between these two
relationships leads me to think that the formula here, if
there exists an accurate one, is not easy enough to be
explained using a linear expression. So I took the data,
using the distance from the center of the club head as the x
coordinate and the deviation from being a center putt as the
y coordinate, and once again inserted it in my calculator.
Instead of asking for a linear regression, I asked for a
quadratic regression, which might possibly fit the data more
accurately. The formula it came up with is y = 1.05x² +
2.55x + .76. Then, since y in this formula represents the
deviation of the putt and I already have another formula
which predicts the distance of the putt from the deviation, I
can combine the two formulas to make a larger one that
predicts the distance of the putt from the distance that the
ball is struck from the center of the club head. In this
case, y represents the distance of the putt, and x represents
the distance from the center of the club head; y = -2.240747x
+ 10.88363x³ - 6.96959x² + 15.16932x + 133.783. Although
long, this formula will in theory predict the distance that a
putt will travel according to the place on the club face
where the ball is struck. In an effort to even more
complicate the situation, a point can be derived for the
distance and deviation of a putt, using only the distance
that the ball was struck from the center of the club face.
The point looks like this: (1.05x² + 2.55x + .76, -
2.240747x + 10.88363x³ - 6.96959x² + 15.16932x + 133.783),
where x is the distance that the ball is struck from the
center of the club face. This formula set can approximate the
point where the ball will end up. However, I must restate
that these formulas are extremely rough and inaccurate
because of all the rounding necessary in making the
calculations. Also, the approximations made by the calculator
in an effort to find quadratic formulas which best fit the
data has further generalized the results. The conclusions
which I have come to should be dealt with in very broad
terms, since the intent of this study was to prove the
general trend of putts as balls were struck on different
parts of the putter.
The hypothesis of this experiment was that a
putt hit on the heel of a putter will deviate left and be
shorter than a center putt, and a putt hit on the toe of the
putter will deviate right and be shorter than a center putt.
Not only has this hypothesis been proven accurate, according
to this experiment, but the situation has been explained in
greater detail than initially intended. The conclusions of
this study have suggested a formula which can predict not
only the deviation of the putt after the ball is struck, but
also the length of the putt by using only the position on the
putter face where the ball is placed. This study will provide
a reference for future, more accurate, and precise studies to
work off of.
Bibliography
Collisions. Eric W. Weisstein and Wolfram
Research Inc [online]. 1999-2000 [sited 10/24/2000].
Available from World Wide Web: <URL: http://www.treasure-troves.com/physics/collision.htm>
Dwell Time. Fisher Golf Inc [online]. 1998
[sited 10/24/2000]. Available from World Wide Web: <URL: http://www.fishergolf.com>
Giancoli, Douglas C. Physics 3rd Edition. 1991.
Prentice-Hall. New Jersey.
Putter Comparisons. Dandy Golf Company [online]. 2000
[sited 10/24/2000]. Available from the World Wide Web:
<URL: http://www.dandygolf.com/indexflash.htm>
- This website compares the Dandy Putter to other
leading brands in off-center hits. It has available
downloads for realtime video.
Putter Testing. Golf Club Review.com [online]. 1999-2000
[sited 10/24/2000]. Available from World Wide Web: <URL: http://www.golfclubreview.com/putting.htm>
- This website overviews several different tactics in
testing the accuracy of a putter. It suggests
different test which can be done.
The Most Accurate and Forgiving Putters in Golf. Carbite
Golf [online]. 1999 [sited \tab 10/24/2000]. Available from
World Wide Web: <URL: http://www.carbite.net>
- This website, although primarily a source of
advertisement, shows some educational elements within
the text. There are some key concepts of putter
weighting which are addressed in the article.