BY ANNA CORBETT AND KRISTA HEIM
TABLE OF CONTENTS
Background Information
Method
Results
Discussion
Links
Bibliography
Return to Research Page
The source of sound we use in our experiment is the human voice. The only purpose of the human voice is to produce sound. It is a live instrument (Meano1967). Unlike most instruments however, the timbre of a voice can be widely manipulated. Many variations can come from the same voice. For example, when an actor plays multiple characters in a performance, each with distinct voice quality. This is done by changing the shape of the throat and mouth (McClosky1959). In our experiment, the variable is change in timbre that results from a change in the vowel the mouth is forming.
To accomplish this, we will analyze data provided by a computer program. The primary focus of our analysis is on overtones. Overtones are components of a note that has a higher frequency than the main pitch (fundamental frequency) and are usually less intense (Clark 1990). From the computer program, we will get a picture of the sound wave of a sung frequency and analyze the shapes of the graphs. It is already known that a shape in resonating cavities can produce different overtones, so we look at to what extent that knowledge applies to different vowels and the sounds of the human voice (McClosky 1959).
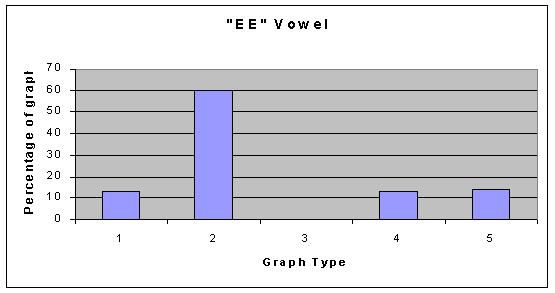
The vowels we will be using for our research are A EE AH OH and OO. We believe that the EE vowel will result in the most overtones, which will result in a more clustered graph. Then A OO OH and AH, in that order, from more to less overtones.
Method
Our procedure was simple and effective. One person at a time, we recorded their voice on the a vowel for three seconds on a pitch of 440 Hz. Then we recorded them on an ah, and then an oh, and so on. We saved the data and moved onto the next person. Having the data collection process completed, we then had SoundView display graphs of all of our data.
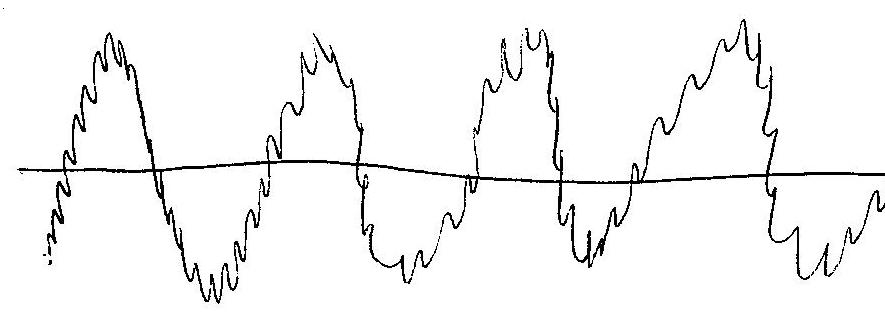
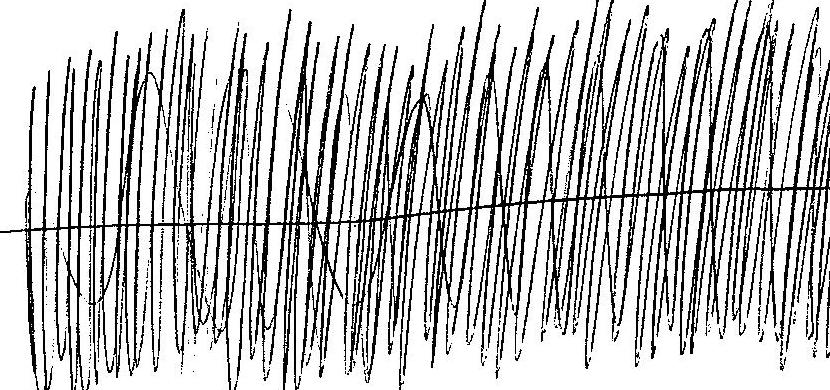
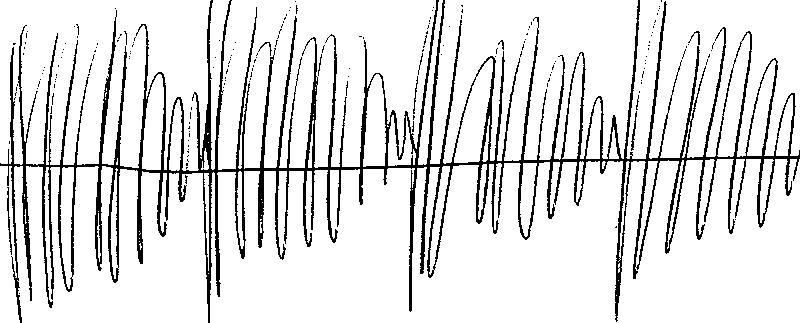
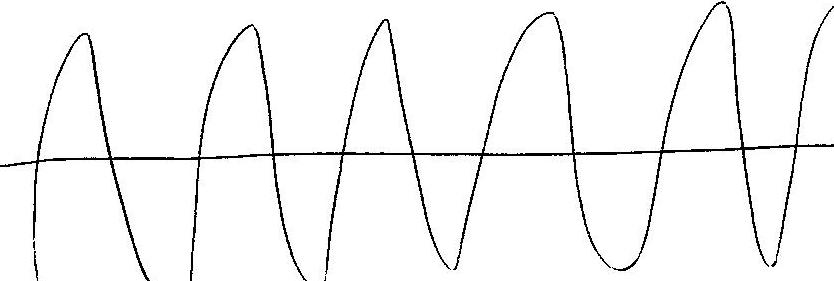
Our results varied greatly from person to person and vowel to vowel. Using a graph with decibels as the y-axis, and time as the x-axis, our results yielded five general graph types.
Type 1:
Type 2:
Type 3:
Type 4:
Type 5:
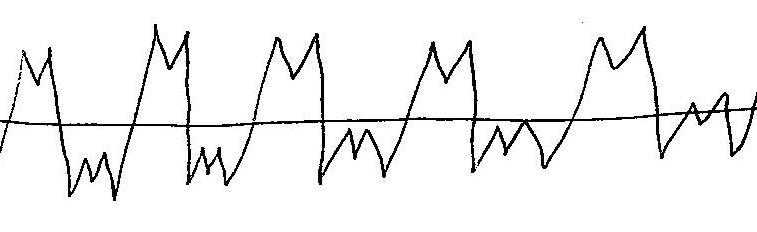
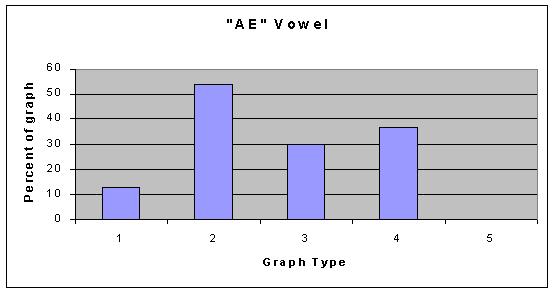
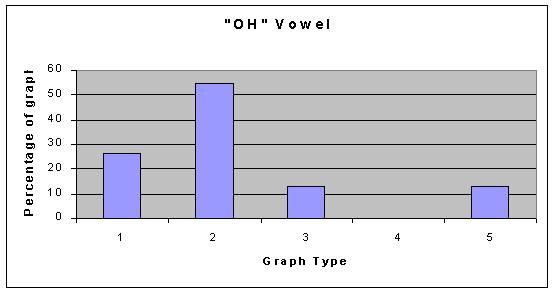
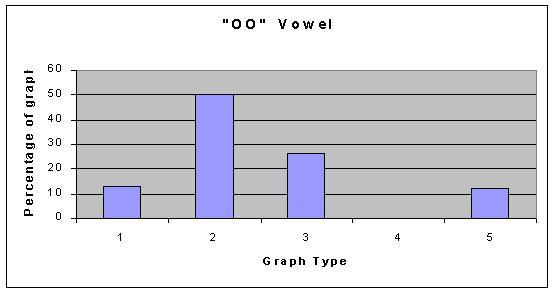
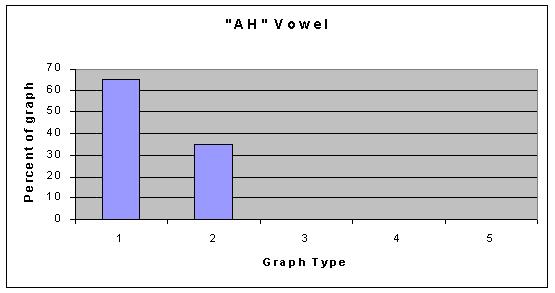
As you can see, the types of graphs are very different, however, all of our graphs can be categorized into one of those five categories; with small exception, none of the graphs stood out as an individual. As far as the vowels are concerned, some vowel sounds typically resulted in the same type of graph, and some did not. The following graphs show what percent of the data resulted in each graph type for each vowel. Data File for all graphs.
Discussion
So, what does our data conclude? We think that the data supports the fact that vowel shapes do not affect the overtones in any set manner. This is not to say that they do not affect them at all, just that we cant conlude anything defininte from our data. Our hypothesis is now irrelevant because we cannot say that any of the vowel shapes produced more overtones than the others. The only thing to not about our data is that the AH vowel shows graph type 1 as its most common. Graph type 1 is much more sparse than graph type 2 (the common one for all the other graphs), and this is something that could be looked into with more advanced technology. If anything, we can conlude that the AH vowel might produce different overtones than other vowels in a general sense.
We can try to explain our graphs by giving all the credit to timbre. Most likely, the difference in peoples color of voice is what made the differences on our graphs as opposed to vowel shape. Regarding the commonality of graph type 2, we think it might be explained a few different ways. One reason they w might be common is because we had every person singing at 440Hz. The graphs could have turned out so similarly because the pitch was the same, and the few graphs that werent the norm may be so because 440 Hz. falls in different places in peoples ranges. For example, a 440 Hz. is a piece of cake for a soprano, but it is sometimes a strain for a bass to project a frequency so high. The second reason for the commonality of graph type 2 is the fact that we had all of our people sing without vibrato. We think that the flatness of the tone might have influenced the graphs to be less rigid like the sparse graphs are, but rather solid and fluid like the dense graphs are.
It would be fascinating to continue researching the human voice to try to figure out if either of out explanations for the commonalities are correct, or if the commonalities are due to some other factor. It might be something completely different than the fact that they all sung the same pitch or that they all sung without vibrato. A continuation of the study of vowels in such varied situations would also be interesting. Our data is limited and so is our technology, and a study using different equipment, a larger group of people, and more variables might help us better understand all we can about sung pitches.
Links
Sound waves-
This is a university website that explains many physics concepts.
The Soundry-
This is a thinkquest website that explains many basics of sound.
Vowel Resonance-
This is located on another university website. This link will direct
you to a page that contians a handbook on acoustic ecology. The page
also contains information specific to vowels.
Soundview Page-
This is the site where the program that we used for our research can be
down loaded.
Spectograms
of Vowels- This is a .pdf site with a few spectograpms of vowel
sounds for a research project.
http://trill.berkeley.edu/classes/ling110/HandoutsHomeworks/section_spec.PDF
Bibliography
Clark, John and John Daintith. The Facts of File Dictionary of Physics. New York:
Checkmark Books, 1990.
Giancoli, Douglas C. Physics: Third Edition. Englewood Cliffs, New Jersey: Prentice
Hall, 1991.
McClosky, David Blair. Your Voice at Its Best. Boston: Little, Brown and Company,
1959.
Meano, Carlo M.D. The Human Voice in Speech and Song. Springfield: Charles C.
Thomas, 1967.
Miller, Donald G. and Harm K. Schutte. Journal of Voice, Volume 4. Feedback from
Spectrum Analysis Applied to the Singing Voice. New York: Raven
Press, Ltd.