Air Cannons: a Study on How Velocity
Varies with Pressure
Table
of Contents:
Introduction | What Data I Collected | Table of Average Distance | Average Distance Graph | Quart Regression Accuracy | Cubic Regression Equation | Graph 1 | Graph 2 | Graph 3 | PSI Vs. Average Time Data | Beanbag Velocity Calculations | PSI Vs. Velocity of Beanbag Data | Logistic 83 Regression | PSI Vs. Velocity of Beanbag Data (Lower) | Graph 4 | Graph 5 | Conclusion | Uncertainty | Improvements | Appendix A: Design | Appendix B: Data | Bibliography | Links | Full Data File
Many times have the great thinkers of our world pondered the essential question to man’s existence: how much faster will a projectile shoot out of an air cannon with an increase of 10 PSI (68947.6 Pa) in the air chamber? Now it may sound like I’m exaggerating, but it’s true. This study is the reason physics was invented: to measure the velocity increase with a pressure increase in air cannons. (Well, that and to be able to explain all physical phenomenon using mathematical formulas).
The basic tools to conduct this study with were first laid down by Sir Isaac Newton. He developed the theory that all actions have equal and opposite reactions which lead to the conservation of energy and the conservation of momentum laws. These two laws are vital to this experiment as nothing could be calculated without them.
Next came Robert Boyle, Jacques Charles, and Joseph Gay-Lussac who discovered the laws which combined into the Ideal Gas Law. This states that if the temperature is kept constant on gas, the gas will have “double the pressure in a volume that is half of the original volume” (Giancoli 346). The pressure increase inside the air cannon is effectively created by the same situation—an amount of air is pumped into the same volume making more molecules share the same confined space. This increase in pressure inside the air cannon’s air chamber exerts a force in all directions, and when the sprinkler solenoid is fired, this force is transferred unilaterally through the valve and out the barrel. In leaving the barrel, the air exerts some of its force on any obstructions to the free flow of air (i.e. the projectile). This force is unbalanced, which gives rise to Newton’s first law of motion. In it he states that “a force (i.e. the air pressure) is needed to change the motion of a body (i.e. the projectile)” (Christianson 292).
Ultimately, this force is directly unmeasurable, unless high-tech timing techniques are used, like those used in ballistics. These include “high-speed film in conjunction with accurate timing equipment, which leads to increased accuracy” (Rinker 25).
Last of all, we have the Air Cannon design. I pulled this design together from many different designs on the Internet, but I found most of my information at
http://www.angelfire.com/il/pneumaticspud/index.html and http://www.calisland .com/apcg/pneumatic/index.html. The site http://www.angelfire.com/il/pneumatic spud/index.html showed the general design that I used and provided a parts list along with cannon specifications. The site http://www.calisland.com/apcg/ pneumatic/index.html gave me many ideas for the improvement of the cannon and helped me to change the design to fit my experiment.
I have yet to state how I will measure the projectile’s velocity (the projectile will henceforth be known as a beanbag). I will place a car in front of the cannon with a backstop capable of stopping the beanbag’s forward momentum and capable of transferring the beanbag’s forward momentum into the car’s forward motion. I will then measure how far the car rolls before stopping. I will also measure the pressure inside the cannon before it fires to see how the car’s stopping distance (ultimately the beanbag’s velocity) correlates with the pressure the cannon was at. It is my belief that the distance to pressure correlation will not be linear but varied in the form P=k*(s)1/2 where: k is a constant, s is the distance the car stops at, and P is pressure.
First I took the data in 110 tests over 10 different pressures (15-60 in even increments) and found each pressure’s mean distance. They are:
|
Average Distance |
PSI |
Average Distance |
PSI |
Average Distance |
|
|
15 |
0.075353 |
35 |
0.584835 |
55 |
1.595755 |
|
20 |
0.237913 |
40 |
0.763905 |
60 |
1.847850 |
|
25 |
0.358775 |
45 |
1.104900 |
|
|
|
30 |
0.476250 |
50 |
1.325245 |
|
|
These means give the most accurate readings for my data points. This data graphs into an odd shaped graph without the look of a linear function or a root function. Here is the graph:
This graph appears to be vaguely polynomial in form. This brought me to the realization that I could find an equation that closely approximates this line using the data analysis tools of my calculator. I tried all the regression formulas that contained an x^_ in them because the graph seemed to have the shape of x^2 but with more local minimums and maximums. This suggested a higher order polynomial. As I went up in power, the equation became more accurate to the data as witnessed by the square of the correlation coefficient becoming closer to 1.
QuartReg(PSI,Average Distance) à R2=.998302900804 à R=.999151090078 (Where PSI & Average Distance are lists that come from the PSI Vs Average Distance table)
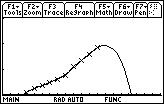
This means that the equation is accurate to the data to within 99.915%. However, just because the formula is accurate to the data that I have recorded, doesn’t mean it is a good equation. If I check the equation past the data, the graph makes a sharp downturn back to zero at about 81.43 PSI. The data doesn’t suggest this at all, and since I am looking for a formula that I can extrapolate answers from I should pick a formula with a more accurate end behavior. Since I can’t get a QuintReg equation, which would give the appropriate end behavior and most likely be more accurate, I’ll have to go with the formula produced by the CubicReg.
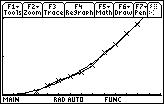
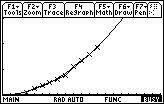
CubicReg(PSI,Average Distance) à y=-4.407666E-8*x3+5.177051E-4*x2+ 5.920664E-4*x-.016577 with R2=.995268670425 and R=.997631530388
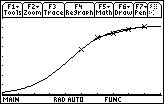
These graphs show the data plotted against the equation. The Line is the equation while the line with the x’s is the data. Graph 1 shows the close correlation between the equation and the data. Graph 2 shows how the equation predicts a plausible end behavior for the data. Graph 3 is a graph of the QuartReg and shows why selecting this equation for extrapolation would be a mistake.
This is of
course a distance formula not a velocity formula. However, when timing the experiment, the lower pressure time
intervals for the car to stop were so small as to make them inaccurate when
compared to their uncertainty. For this
reason, I will not find the actual velocity of the ball except for the last
five pressures. The average time for
each pressure are as follows:
|
Average Time |
|
|
40
PSI |
3.57 |
|
45
PSI |
4.02 |
|
50
PSI |
4.54 |
|
55
PSI |
5.08 |
|
60
PSI |
5.65 |
Beanbag
Velocity Calculations:
r=m*v & v=s/t & r1=r2 à m1*v1=m2*(s/t) 2 Where m1=mass of beanbag=.059kg, v1=beanbag velocity (unknown), m2=mass of car only (beanbag sops on line where car gets hit)=3.231kg, s=distance car moves (variable), & t=time it takes car to move distance s. (Note: s/t gives the average velocity for the car over the interval, not the initial velocity when the car is struck. Since acceleration is assumed to be constant, (v+u)/2 =Vav. So the initial velocity of the car would be double its average velocity if the final velocity were 0.) à m1*v1=m2*(s/t) 2*2 à (.15)(v1)=(1.34)(s/t)(2)
This produces the following data:
|
Velocity of the
Beanbag |
|
|
40 PSI |
23.429 |
|
45 PSI |
30.094 |
|
50 PSI |
31.961 |
|
55 PSI |
34.394 |
|
60 PSI |
35.810 |
Velocity is in meters/second. Using the same method I used earlier to find a general equation for the distance the car would go, I found a formula for which I could extrapolate the lower velocities I was unable to measure. However, using the power regressions gave unlikely answers for the values that I didn’t collect. This led me to try the other regression formulas. The on that came closest to matching the data while providing reasonable lower pressure values was the logist83 regression. This gave me:
Logist83(PSI,Velocity
of Beanbag) à y=36.157516/(1+342.34709*e-.161923*x)
Using this formula, I was able to extrapolate the lower end velocities of the ball. They are, according to the formula:
|
Velocity of the
Beanbag |
|
|
15 |
1.1598618762479 |
|
20 |
2.5060119933221 |
|
25 |
5.1831361079000 |
|
30 |
9.8804742549612 |
|
35 |
16.5590357229050 |
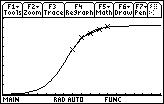
Here are the graphs. Graph 4 shows how closely the equation fits the line while Graph 5 shows how the equation is likely to predict accurate velocities for higher or lower pressures:
Thus I have come to the conclusion that as an Air Cannon has increasing amounts of air, p, pumped in, the velocity will be determined by the formula: v=36.157516/(1+342.34709*e-.161923*p) where v=velocity, e=the constant e (2.78…), and p=the pressure of the air chamber. Though I was wrong about the form of the equation (it isn’t v=k(p)1/2), the equation I guessed would have a similar end behavior to the right equation (the increase would be quick at first and then rise slower and slower). At first it seemed that the distance equation would be directly varied with the final, velocity equation but when I made this assumption, I forgot to take into account the fact that as the distances increased somewhat linearly, the time to stop increased as a square. This made the distance equation have little to do with the velocity equation.
There were many different factors that each increased uncertainty in my experiment. One of the first factors was the fact that my pressure gauge was analog and not digital. A digital gauge would improve the accuracy of the gauge by 1.5 PSI either way, so my uncertainty for my air pressure is +/- 1.5 PSI. Also, the way I measured the distance the car traveled was not precise, varying as much as 3/8”. This makes the distance vary over +/- 3/8”. The way I measured time was probably the greatest cause for uncertainty in my experiments. The method I used to time, a stopwatch, could vary .85s. This gives my time uncertainty at +/-.85s. One of my unmeasurable variables was the height at which the beanbag hit the backstop, and at what angle. The lower the beanbag and closer to 90° it hit the more of its energy it transferred to the car. The cause for the uncertainty here is the fact that the barrel shoots the beanbag out with an unknown amount of friction force on each side. This could cause the beanbag to spin or ultimately deflect from its true course. As long as this deflection is up or down the data isn’t altered too much. But if the deflection is side to side, an extra vector component is picked up which lessens the total forward distance. Another, unmeasurable, variable is the way the beanbag is shoved into the barrel of the cannon. If the beanbag is elongated instead of widened in relation to the barrel, the pressure, when released, will be less, causing a decrease or possibly even an increase in beanbag velocity.
Taking the unmeasureable uncertainty factors in along with the measurable ones gives an uncertainty of +/- 15 m/s for the velocity on average. Lower pressures will most likely have a higher uncertainty than higher pressures however, for higher pressures’ velocities are less affected by barrel friction and the way that the beanbag is put into the cannon. This is another reason why I chose not to find the lower pressure’s velocities experimentally.
This experiment could be improved in accuracy if it was conducted inside a vacuum with laser or other high accuracy measuring devices. One of these improvements could be an atomic clock on board and a speedometer to show when the car is and has stopped moving. Also a perfectly smooth surface for the car to roll on would increase accuracy. With a smoother surface the distance readings would be longer and thus more distinguishable from similar readings. The car could be decreased in mass too to give the same effect. The wheel bearings could also be decreased in friction constant and the wheels could be made to have a much lower moment of inertia. All of these would make the car easier to move. Also, a perfectly round projectile could be found that would perfectly fit a sanded and polished barrel. This would increase the speed of a projectile out of the barrel and help provide more accurate measurements—it wouldn’t matter how the ball was put in; it would be the same no matter what. However, these improvements are mostly too costly and many are out of the question when it comes to implementation. With the materials and abilities that I possessed, this was a very good project as I found what I was looking for: a formula for how much faster a beanbag will go with an increase in pressure in an air cannon.
Design
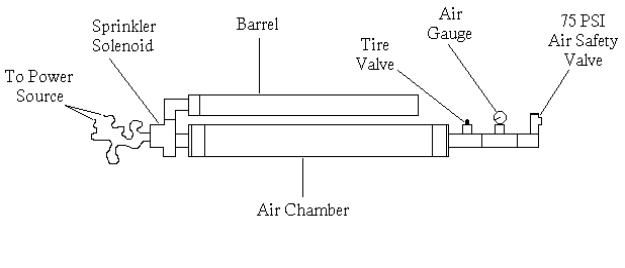
Table of Contents ï Back to Text | Page Down | Page Up
This is the design of the air cannon I built. All formulas that are generalized to include
all air cannons are in fact including all air canons built and tested with the
same specifications as mine. These
specifications are:
36” x 3” air chamber, 24” x 2” barrel, 2 1” x 3” reducers, 13.5” x 1” connecting pipe, 2 1” x 1” x ¾” s x s x t valves for air and tire gauges, ¾” air and tire gauges, 1” 90° s x t elbow fitting, 1” 90° s x s elbow fitting, 1” air relief valve, 2” coupling, 2” x 1” reducer, beanbag-.059kg, car-3.231kg with same rolling kinetic friction constant, same density of concrete floor, and last of all same air temperature of 43°F.
Table of Contents | Page Down | Page
Up
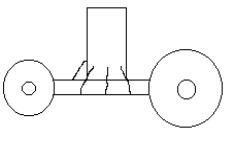
This is the car I used. It had a low kinetic coefficient of friction and a block of wood strapped to it. I made sure that the wood wouldn’t rattle when it was hit so as to transfer all the ball’s momentum to the car.
Appendix
B:
Data tables
Data is in inches; trials are in Pounds per Square Inch:
|
15 PSI |
20 PSI |
25 PSI |
30 PSI |
35 PSI |
40 PSI |
45 PSI |
50 PSI |
55 PSI |
60 PSI |
|
3.75 |
9.00 |
13.25 |
18.25 |
24.50 |
29.25 |
38.75 |
52.50 |
60.25 |
68.00 |
|
3.00 |
9.50 |
13.25 |
17.25 |
23.25 |
27.75 |
48.50 |
53.50 |
61.75 |
69.25 |
|
2.75 |
10.25 |
15.00 |
18.50 |
24.50 |
31.00 |
40.75 |
49.75 |
67.00 |
69.00 |
|
2.50 |
9.25 |
16.00 |
19.00 |
22.75 |
30.00 |
43.75 |
49.50 |
63.25 |
74.75 |
|
2.50 |
8.50 |
14.25 |
19.75 |
21.75 |
29.50 |
45.50 |
54.25 |
63.75 |
73.00 |
|
2.75 |
9.50 |
14.00 |
19.75 |
22.50 |
32.00 |
43.00 |
49.50 |
64.00 |
72.75 |
|
2.75 |
10.00 |
14.25 |
18.75 |
22.00 |
30.50 |
48.00 |
49.50 |
62.50 |
72.00 |
|
3.75 |
9.75 |
13.50 |
18.50 |
24.00 |
30.75 |
41.00 |
54.75 |
64.75 |
73.00 |
|
3.00 |
9.25 |
14.25 |
18.00 |
24.00 |
28.50 |
39.75 |
55.75 |
59.75 |
75.00 |
|
3.50 |
8.50 |
13.50 |
19.75 |
21.00 |
31.50 |
46.00 |
52.75 |
61.25 |
80.75 |
|
3.00 |
9.75 |
|
|
|
|
|
|
|
|
|
3.00 |
9.00 |
|
|
|
|
|
|
|
|
|
2.00 |
9.50 |
|
|
|
|
|
|
|
|
|
2.75 |
9.75 |
|
|
|
|
|
|
|
|
|
3.50 |
9.00 |
|
|
|
|
|
|
|
|
Table of Contents | Page Down
| Page Up | Text File
This is the data converted into the SI units meters and Pascals:
|
103421 Pa |
137895 Pa
|
172369 Pa |
306843 Pa |
241317 Pa |
275790 Pa |
310264 Pa |
344738 Pa |
379212 Pa |
413685 Pa |
|
0.09525 |
0.22860 |
0.33655 |
0.46355 |
0.62230 |
0.74295 |
0.98425 |
1.33350 |
1.53035 |
1.72720 |
|
0.07620 |
0.24130 |
0.33655 |
0.43815 |
0.59055 |
0.70485 |
1.23190 |
1.35890 |
1.56845 |
1.75895 |
|
0.06985 |
0.26035 |
0.38100 |
0.46990 |
0.62230 |
0.78740 |
1.03505 |
1.26365 |
1.70180 |
1.75260 |
|
0.06350 |
0.23495 |
0.40640 |
0.48260 |
0.57785 |
0.76200 |
1.11125 |
1.25730 |
1.60655 |
1.89865 |
|
0.06350 |
0.21590 |
0.36195 |
0.50165 |
0.55245 |
0.74930 |
1.15570 |
1.37795 |
1.61925 |
1.85420 |
|
0.06985 |
0.24130 |
0.35560 |
0.50165 |
0.57150 |
0.81280 |
1.09220 |
1.25730 |
1.62560 |
1.84785 |
|
0.06985 |
0.25400 |
0.36195 |
0.47625 |
0.55880 |
0.77470 |
1.21920 |
1.25730 |
1.58750 |
1.82880 |
|
0.09525 |
0.24765 |
0.34290 |
0.46990 |
0.60960 |
0.78105 |
1.04140 |
1.39065 |
1.64465 |
1.85420 |
|
0.07620 |
0.23495 |
0.36195 |
0.45720 |
0.60960 |
0.72390 |
1.00965 |
1.41605 |
1.51765 |
1.90500 |
|
0.08890 |
0.21590 |
0.34290 |
0.50165 |
0.53340 |
0.80010 |
1.16840 |
1.33985 |
1.55575 |
2.05105 |
|
0.07620 |
0.24765 |
|
|
|
|
|
|
|
|
|
0.07620 |
0.22860 |
|
|
|
|
|
|
|
|
|
0.05080 |
0.24130 |
|
|
|
|
|
|
|
|
|
0.06985 |
0.24765 |
|
|
|
|
|
|
|
|
|
0.08890 |
0.22860 |
|
|
|
|
|
|
|
|
Table of Contents | Page Down
| Page Up | Text File
This is the trial #’s along with the time for each in seconds for those pressures which I could get significant readings:
|
Trial Number |
40 PSI |
45 PSI |
50 PSI |
55 PSI |
60 PSI |
|
1 |
3.45 |
3.92 |
4.52 |
4.92 |
5.80 |
|
2 |
3.23 |
4.12 |
4.60 |
4.86 |
5.57 |
|
3 |
3.59 |
4.05 |
4.23 |
5.12 |
5.67 |
|
4 |
3.89 |
3.82 |
4.34 |
5.17 |
5.43 |
|
5 |
3.45 |
4.08 |
4.64 |
5.06 |
5.62 |
|
6 |
3.93 |
4.21 |
4.57 |
4.97 |
5.76 |
|
7 |
3.48 |
4.03 |
4.83 |
5.34 |
5.45 |
|
8 |
3.52 |
3.89 |
4.48 |
5.18 |
5.64 |
|
9 |
3.49 |
3.97 |
4.81 |
4.84 |
5.61 |
|
10 |
3.67 |
4.13 |
4.38 |
5.37 |
5.96 |
Table of Contents | Page Down | Page Up | Text File
Christianson, Gale. In the Presence of the Creator: Isaac Newton & His Times. New York: The Free Press, 1984.
Giancoli, Douglas C. Physics. New Jersey: Prentice Hall, 1991.
http://www.angelfire.com/il/pneumaticspud/index.html
http://www.xinventions.com/home.htm
Rinker, Robert. Understanding Ballistics: Basic to Advanced Ballistics—Simplified, Illustrated, and Explained. Corydon, IN: Mulberry House Pub. Co., 1996
Backyard Ballistics - http://www2.csn.net/~bsimon/backyard.html - A good site for technical information and safety studies
Chunker’s - http://www.geocities.com/Heartland/Acres/8558/ - This site has the statistics for a lot of professional pumpkin launching contests
Guinness-Addict'sAir
Cannon Page - http://www.geocities.com/MotorCity/Downs/6340/spud.html - A
site with information on how to make an Air-Cannon that will launch spark plugs
up to a ¼ mile
Master Blaster Spud Gun
Page - http://www.valuelinx.net/~dthames/spudguns.htm
- A site with a lot of good
pictures of Air-Cannons
Pneumatic Air Cannons - http://www.angelfire.com/il/pneumaticspud/index.html - This page gives a materials list for how to make a pneumatic Air-Cannon
The Spudgun Technology Center - http://www.goldmann.com/spudgun.html - Home of exciting new advancements in spud gun technology
Xinventions.com - http://www.xinventions.com/main/spud/home.htm - Lots of info and pictures on spud gun’s and other interesting stuff