Room Acoustics:
The Quality of Musical Performance in the Auditorium
of Boones Ferry Community Church
Jamie
Cherry
January
2000
IB
Physics II
Introduction | Statement
of the Problem | Review of Related Literature | Hypothesis
Sound in an Auditorium | The Set Up | Procedure | The Trial Test
Speaker Position #1 | Speaker Position #2 | Speaker Position #3
Discussion | Conclusion | Bibliography | Hyperlinks | Raw Data Files
Many aspects of life are affected by the results of sound waves in the air, water, and the earth. Acoustics is the study of sound and its behaviors. The science of acoustics studies four main areas: earth sciences, life sciences, engineering, and the arts. It can be applied by communication through speech and the performance of music, or in advancements of medical research, security of architectural structures, exploration of the ocean, and prediction of seismic waves and activity.
One common area of acoustical study is musical performance. It is the performer’s desire to enchant his audience with his music. In order to reach the full potential of musical satisfaction, it requires an acoustically sound room. This means that sound waves reverberate at the right time; the pitch, tone quality, and loudness are pleasing; and resonance, beat frequencies, echoes, and ambient noise are minimized.
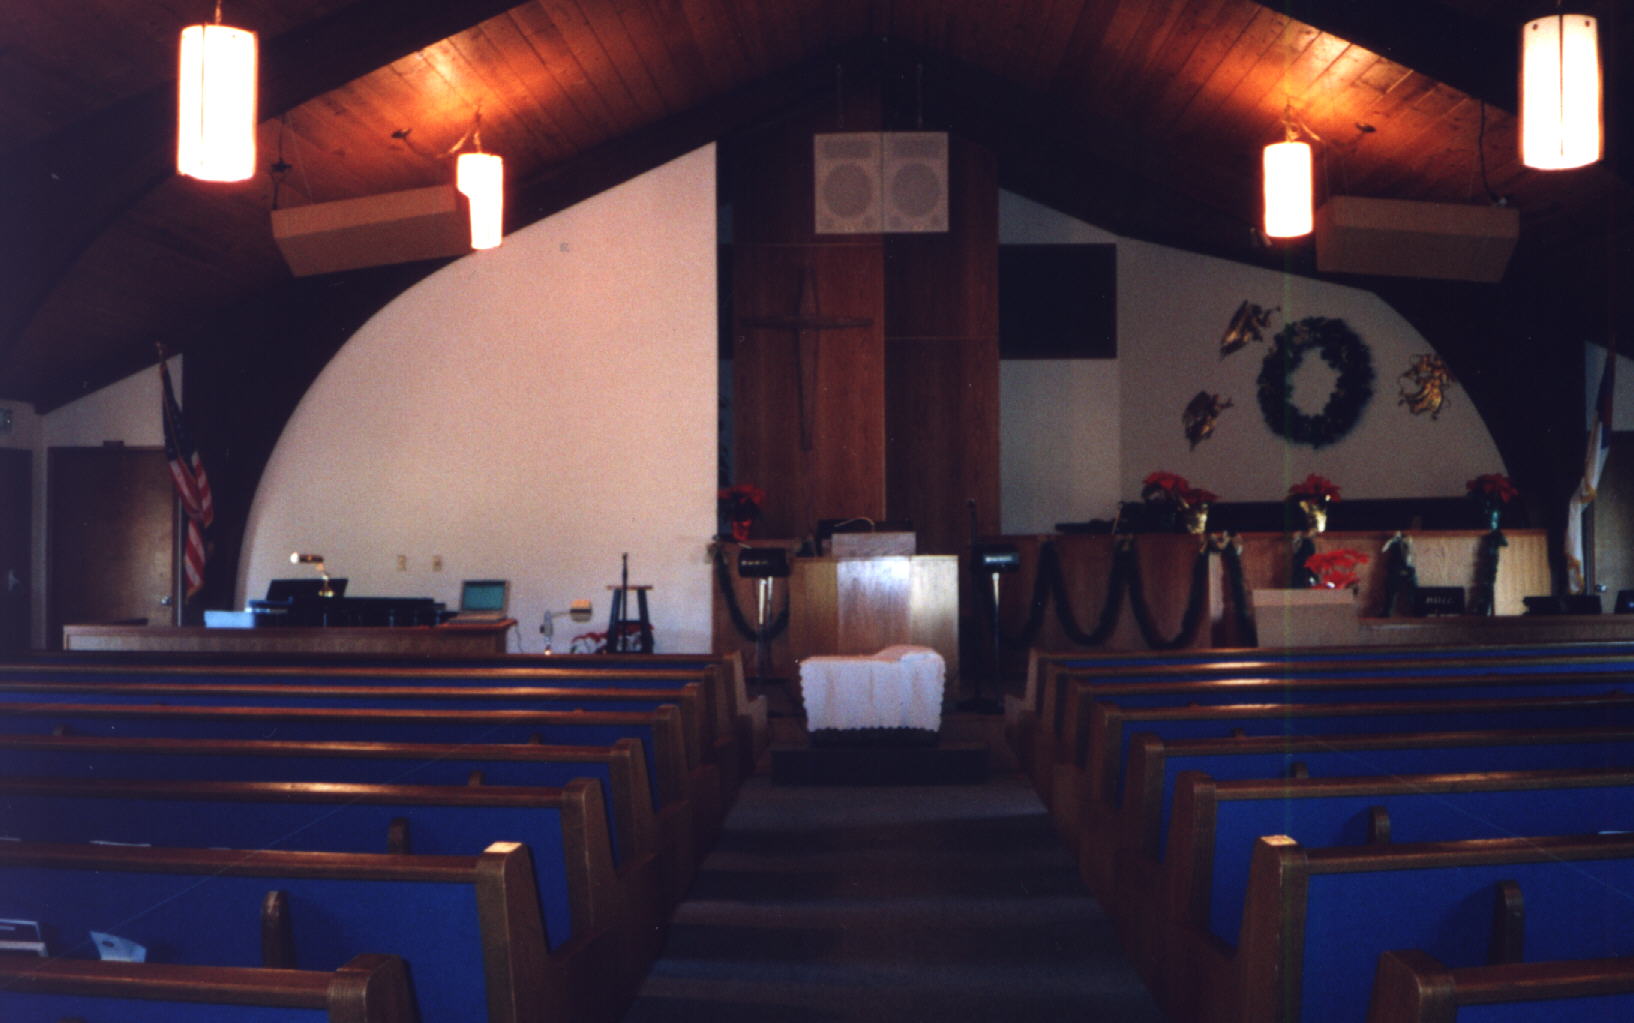
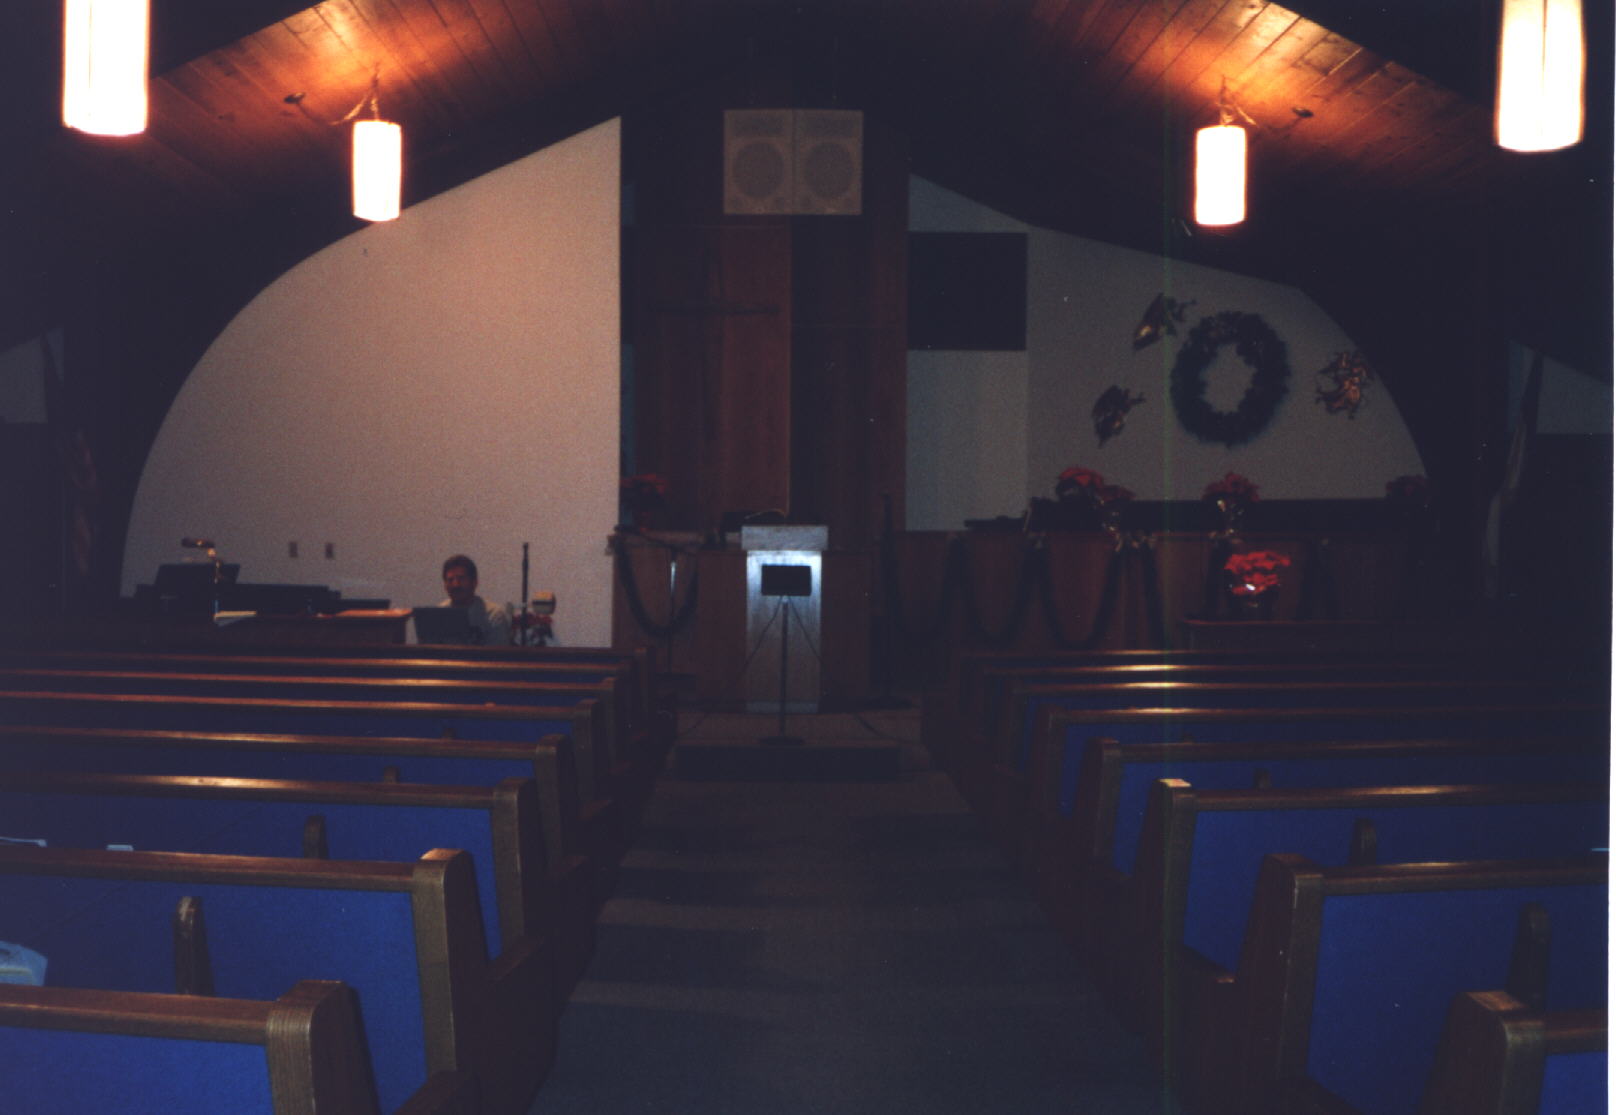
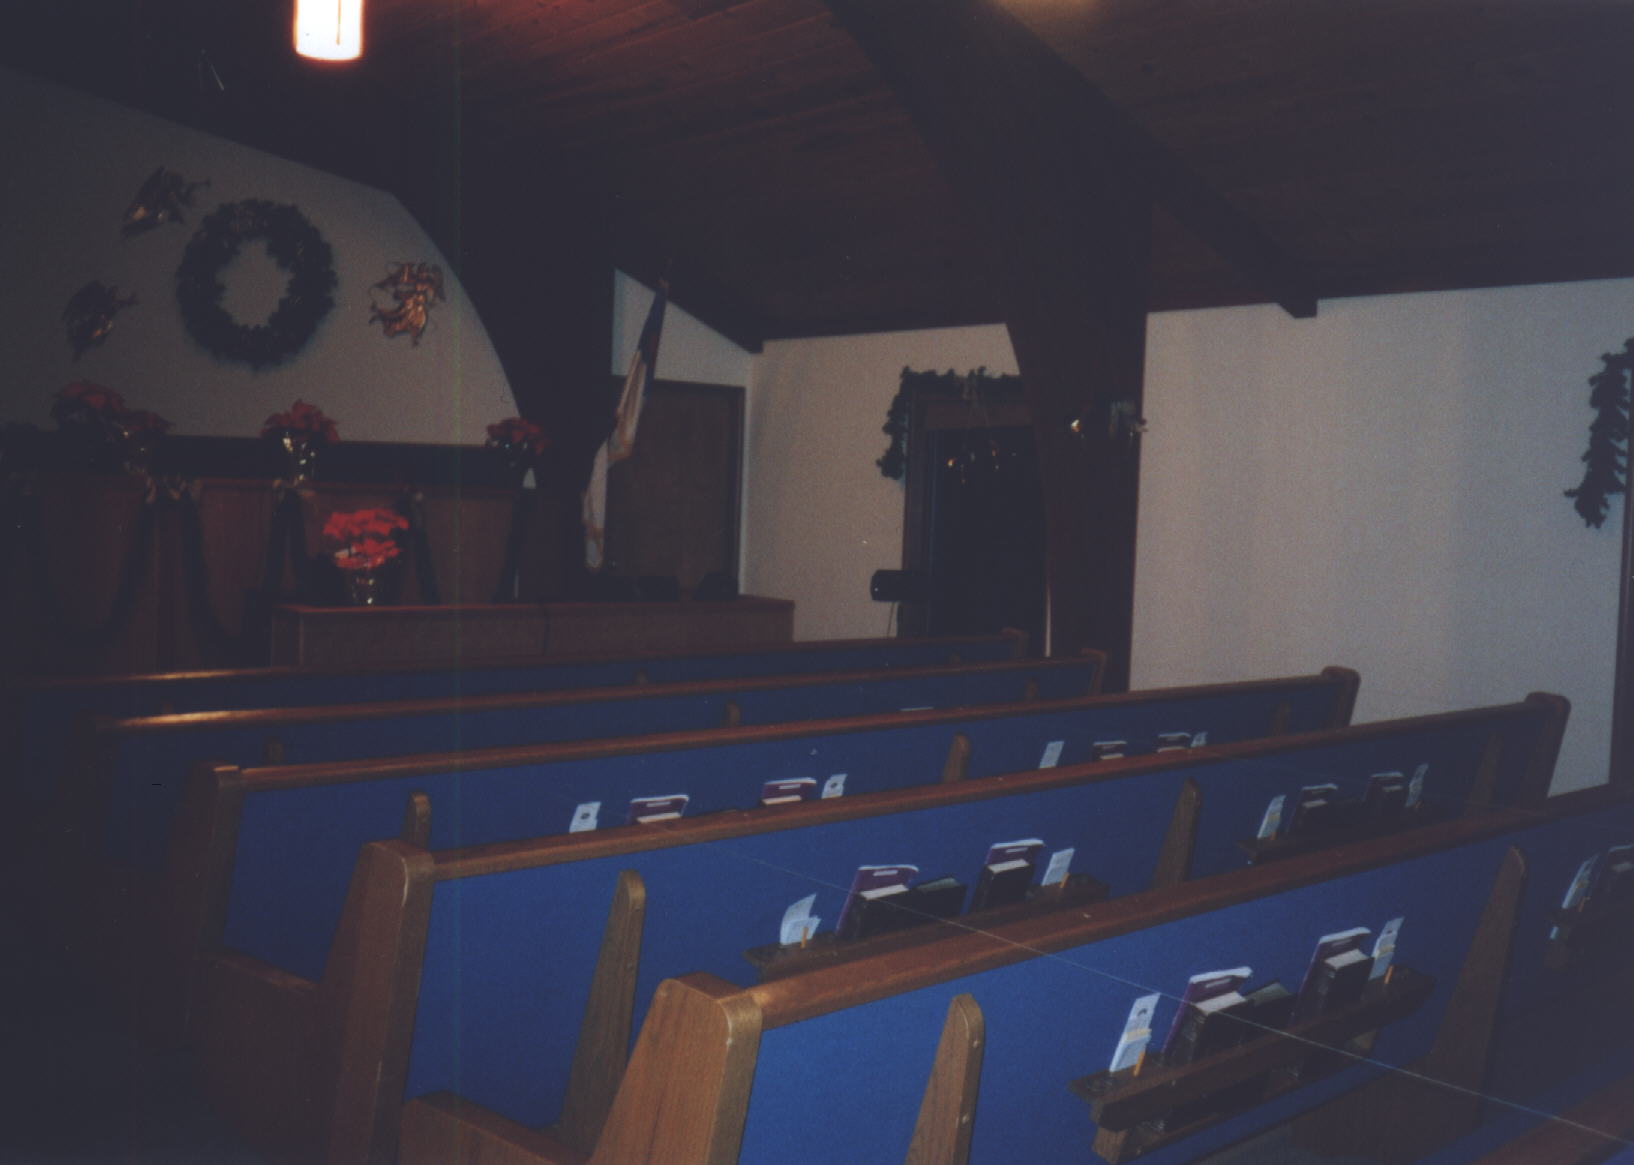
The Boones Ferry Community Church auditorium has several "dead spots" where music and certain voices cannot be heard well or at all. The purpose of this study is to locate these "dead spots" and to remedy them by the manipulation of sound equipment and the placement of objects in the auditorium.
Sound is composed of waves at different frequencies, intensity levels, and waveforms. These waves are produced by a source and are reflected off of or absorbed into objects in their path until they eventually decay.
The subject of room acoustics deals with the manipulation of sound waves through the use of absorbing and reflecting materials, positioning of objects and speakers, and architectural design of the room. Different methods for attaining good acoustics have been developed to help amateurs. "The Cellular Approach for Modeling Room Acoustics: A Framework for Implementation Based on the Ray Tracing Algorithm" is a step-by-step method using upper level mathematics to decipher the paths and deterioration of sound. Also, it is common for sound reproducing companies to issue helpful tips on room planning and preparation to their customers before they purchase a particular product. Newform Research gives placement advice concerning absorption and reflection and room examples to help assure their customer’s satisfaction with their sound system. Genter Technical Support provides information on reduction of ambient sound, reverberation, echo, room planning, and different treatment to remedy problems. These tips can be applied to any room to improve its acoustics.
A room that attains high acoustical performance takes these aspects into consideration: suitable loudness of sound, achievement of low ambient noise, reduction of echoes and resonance, placement of boundaries to reflect sound uniformly throughout the room, and calculations of appropriate reverberation time for a given source. These aspects are not uniform for every situation. Depending on the type and style of the music, this criterion may vary to produce the desired effect. For example, some music portrays warmth and intimacy while others may be brilliant and lively. Warmth and brilliance are determined by the reverberation time of a low frequency range compared to medium and high ranges. Constant reverberation time is classified as "brilliant" while lower frequency reverberation is described as "warmth". The liveness of a room depends on the volume and surface area of the room. If the reverberation time in a short room is too small, the music may be classified as "dry" or "dead" while having too long of reverberation time may be called "muddy" or "watery." These classifications can be made because with reverberation come diffraction, reflection, interference, and refraction. As sound waves bounce off of objects and each other, they generate pockets of very loud sound or no sound ("dead spots") or an alteration of pitch or tone. Many components of sound are analyzed when determining the best possible way to design a room for its specific purposes. It is necessary to decide beforehand the use for the room in order accommodate the sound source to its potential and purpose.
The Boones Ferry Community
Church auditorium is not acoustically designed for typical church music. Members
have mentioned not being able to hear some people’s voices or pitches while
others voices and music are heard clearly. I believe it is in part due to the
architectural design of the auditorium and placement of speakers that hinders
certain frequencies from reaching particular points in the pews. By estimating
interference, reflection, and absorption using the knowledge of the structure
of the room, frequency, wavelength, and other gleaned information, "dead
spots" can be minimized by manipulating the position of the sound
equipment and the objects in the auditorium.
There are three basic principles assessed in determining the best possible speaker set up and object placement for even sound dispersion in a room. They are interference, absorption, and reflection. Each of these principles presents a variety of difficulties and remedies to common sound problems during a musical performance.
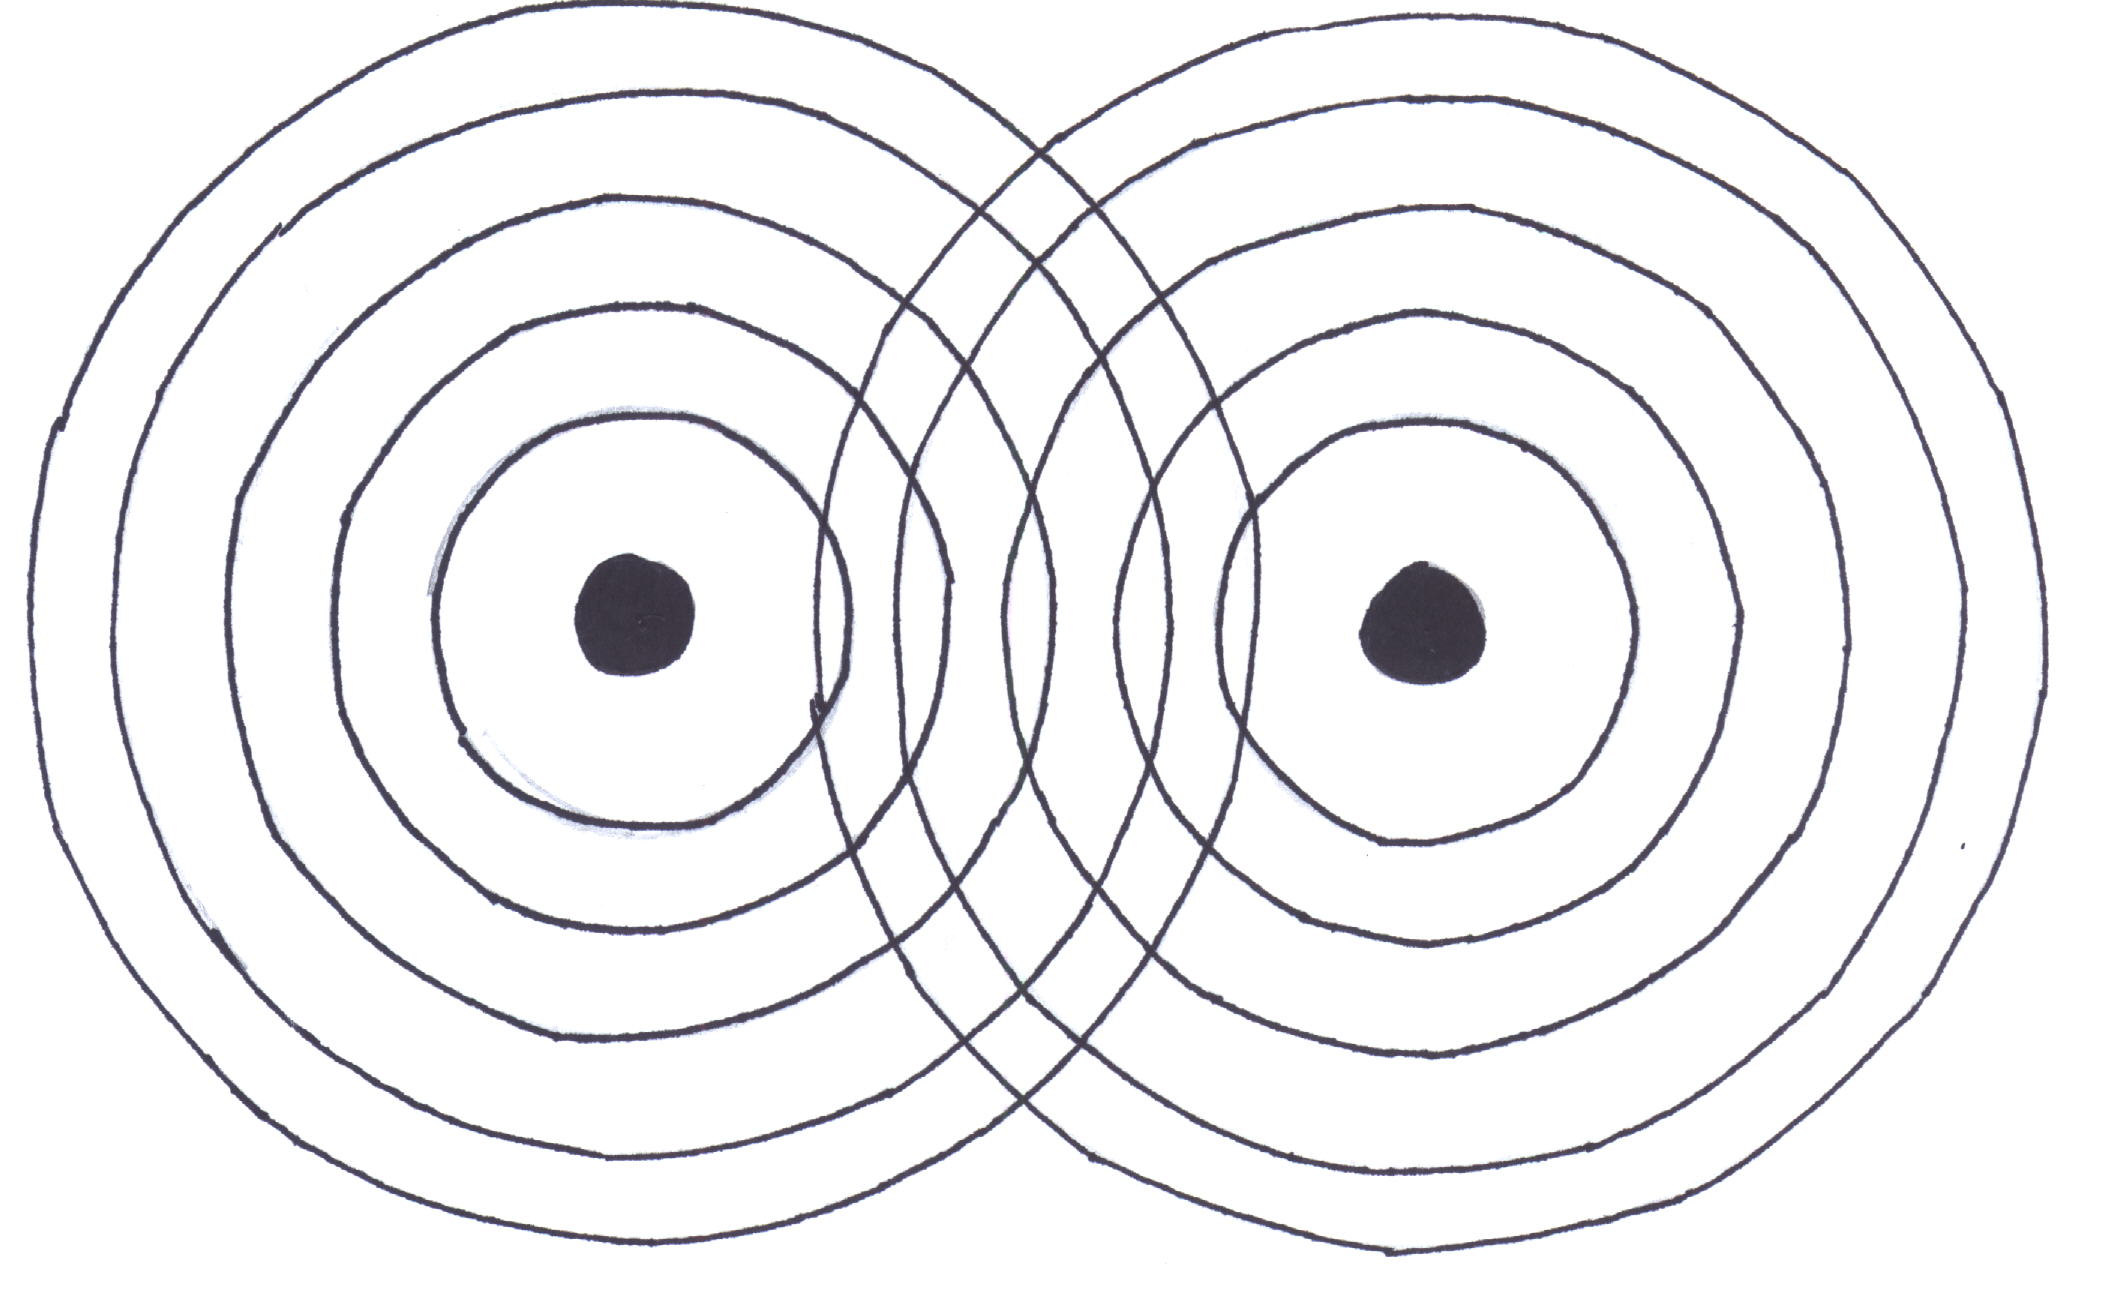
Interference occurs when two waves attempt to pass through the same space at the same time. There can be either a constructive or destructive interference between waves. During constructive interference, a greater intensity of sound is produced than originally emitted from the source due to the combined amplitudes of the waves. Constructive interference results in greater displacement of overall amplitudes and makes a wave with higher intensity. Destructive interference is the opposite of constructive interference. Destructive interference occurs when two waves oppose one another as they pass and cause a reduction of intensity. The intensity reduction is caused by the differences in amplitudes being cancelled and forming a smaller total amplitude. Interference should be taken into consideration when placing speakers in a room to avoid odd effects of a rapid increase or decrease in the loudness of sound.
A key aspect in the control and the dispersion of sound throughout an auditorium is absorption. Certain materials like drapes, rugs, upholstered furniture, or other substances containing innumerable small passages are considered sound absorbers. They diminish the sound energy when waves pass through them. Depending on the use for the auditorium, the absorption characteristics may need to be enhanced to dampen excessive sound or should be reduced to liven and brighten the sound from the source.
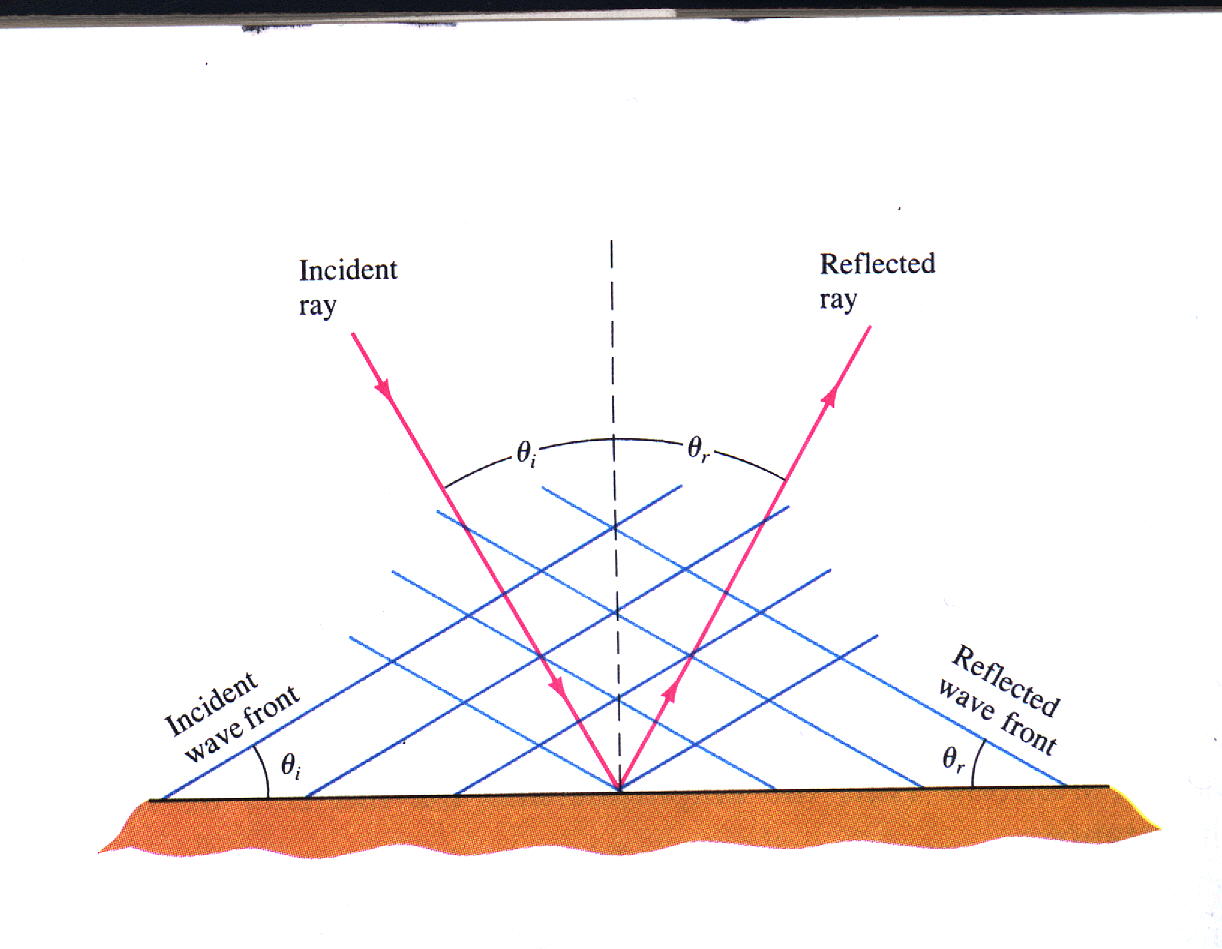
The reflection of sound off of objects is the third main principle in attaining better room acoustics. Objects in a sound wave's path will essentially bounce back with the same strength as the original sound source (if the object is nonabsorbent). In many cases, sound waves do not reflect directly back to the original source, but collide with an object from an angle. When a sound wave hits an object from an angle, it reflects back at the same angle in the opposite direction. The angle of the incoming wave is known as the angle of incidence. The angle at which the sound is reflected is the equal corresponding angle to the angle of incidence. Several common problems that arise from reflection are echoes and excess interference. When considering the effects of reflection in an auditorium, it may be evident that absorbing materials are needed to reduce echoes and some interference. It also could reveal that rigid objects should be added to reflect sound into areas of low pressure (intensity) to create more even sound dispersion.
Physical characteristics are not the only aspects to consider when dealing with sound in an auditorium. Psychological characteristics like pitch, loudness, duration, consonance and dissonance, beats and timbre are not only significant to the performer, but the audience as well. The difficult part to patterning a perfect room that satisfies psychological qualities is that individual preference is involved. For example, pitch is a sense of frequency connected with a tone. Pitch alterations are subjective and are based on the sensory organs in the individual’s ear. While one person can detect a slight change in pitch, the person in the seat next to him could have heard no alteration at all. Solutions to resolving these kinds of problems are purely up to personal preference.
The hardest part to developing an acoustically pleasing auditorium is the blending of the scientific, physical characteristics of sound with the psychological qualities. The best way to establish a room pleasing to everyone is to appeal to the person with the most sensitive ear. Applying the use of scientific knowledge of sound to afford the purest tone, to yield an even dispersion of sound or loudness, and discovering other methods of combining the physical characteristics with psychological qualities, will be the most beneficial means of obtaining an acoustically sound auditorium.
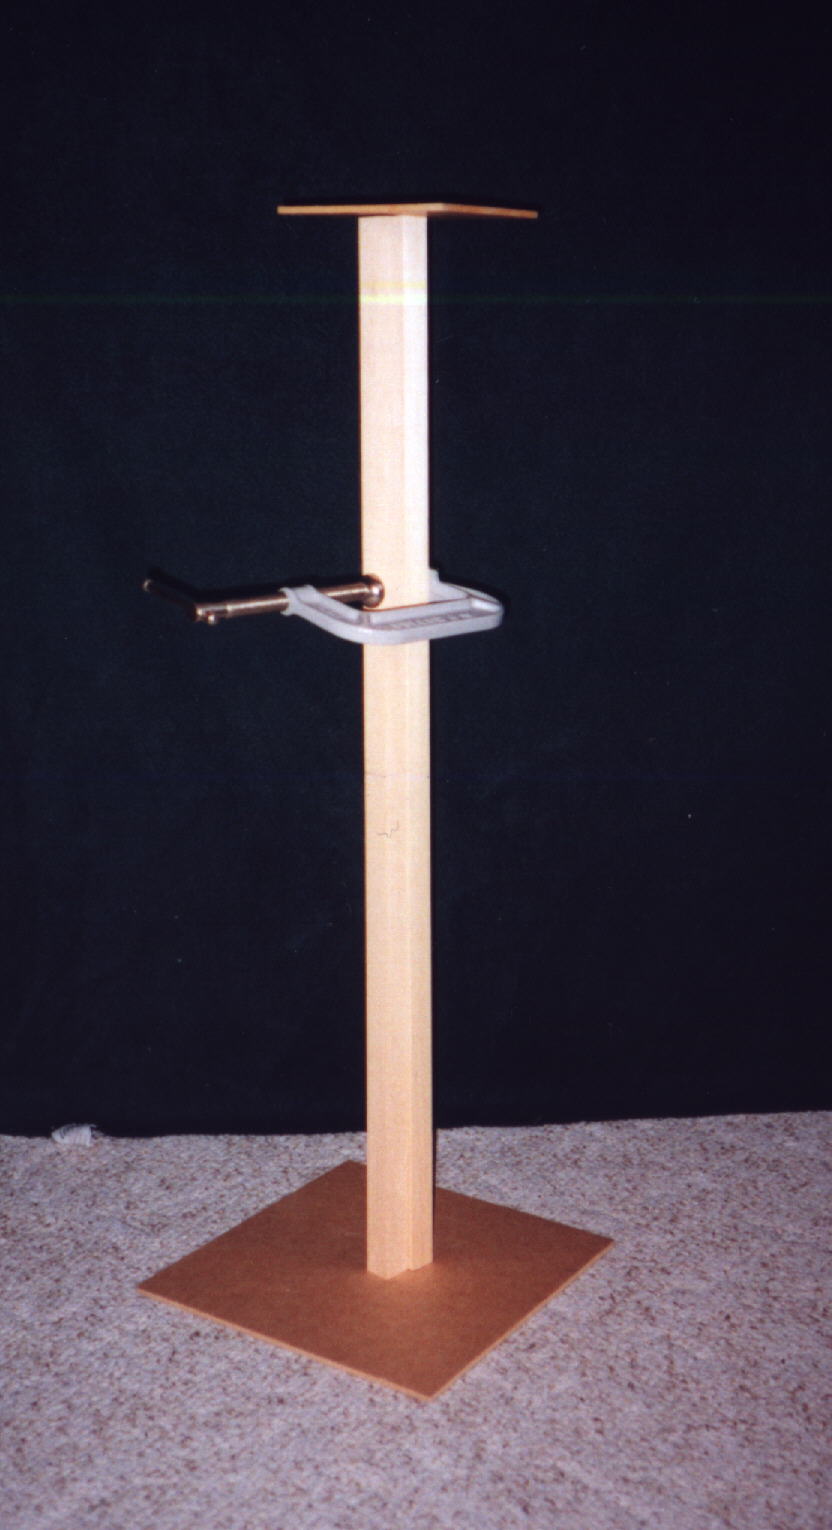
There are five essential parts to the set up for the acoustical analysis of the Boones Ferry Community Church auditorium. The first step is to construct a stand to support the decibel meter. A simple stand like the picture will suffice for this project. The stand in this picture is made from two square pieces of plywood, two pieces of square doweling, two screws, and a C clamp. One screw is used to hold the first piece of plywood to one of the dowels. This procedure is repeated to the other dowel and plywood. Once the dowels have been securely mounted on the plywood, one of the pieces is inverted and placed directly next to the other. The C clamp is fastened tightly. The advantage to this particular stand is its versatility to change heights. It allows for easier mobility in different auditoriums.
The next step is to predetermine the method for data collection. A laptop computer with an Excel spreadsheet was the chosen method for recording data in the Boones Ferry project. As data was being collected, it went directly onto the computer. Having the spreadsheet full of organized data, made analysis, data tables, and charts easier than recording everything by hand.
Step three of the set up is to grid off the auditorium to create specific points to record data. String, scissors, duct tape, and a measuring tape were used to divide the Boones Ferry auditorium into seventy equal squares. One end of the string was cut and taped to the back wall, then the other end was attached to an object on the opposite side of the room so that the string was parallel to the floor. This procedure was repeated until a grid was formed over the entire seating area of the auditorium.
The fourth major step was setting up the sound system and the speakers. Each sound system is designed differently and needs to be assessed for the reproduction of a single, pure tone before the project is ready to begin. In the case of the sound system at Boones Ferry, a tone generator with banana clips and an AC adapter was needed to produce a single, pure tone through individual speakers. Before the project began, the type of connections and special equipment required for the sound system used was checked. (The key factor to attain a pure tone is the ability to manipulate the tone through all of the speakers individually.)
The last and the most important step is the evaluation of the building. Useful tools full of accurate information are the blueprints and visual observations. Information like dimensions, materials, height and position of speakers, and the placement of objects are important to know in order to estimate absorption, reflection and interference.
In order to obtain the most accurate results from this study, different speaker set ups are required and a range of frequencies are needed to test each speaker position. Good frequencies to consider would be tones often heard in that particular type of auditorium and at least one of each from a high, medium, and low range frequency. Since overtones are multiples of the original wavelengths and would have the same reverberation effects, frequencies should be chosen that are not overtones to ensure varying interference patterns that would be common during a musical performance.
Following the speaker set up, test the frequencies to confirm that the speakers, tone producer, and decibel meter are all working. After acknowledging that all equipment is in working order, turn on the tone producer to the first frequency to be tested. Make sure the tone is loud enough to obtain readings from any point in the auditorium and that other ambient noise is minimized.
Once the entire set up has been completed and a single tone is being generated through the auditorium, a very methodical pattern for data collection is implemented. The stand should touch the string lightly at each corner of every box in the grid for consistent data. It should be moved carefully to every corner of the boxes for intensity level measurements through the entire auditorium.
A caveat regarding the decibel meter is that it is affected by the presence of a human body. The person moving the dB meter to the corners of the boxes should read the meter from as far away as possible. Humans absorb or reflect sound that can change results.
Once the intensity level has been measured from all seventy points for the low frequency, continue through the grid again for the next two frequencies without changing the speaker set up. After all data is recorded for the speaker position, take pictures of the set up, measure the height and describe the location of the speakers, and write any other observations in a notebook for later reference before modifying the layout for the next series of tests.
It is recommended that multiple speaker positions be tested to find the best possible scenario to adequately serve the auditorium.
For the initial sound test in the Boones Ferry Community Church auditorium, the speakers were left in their original position from a typical Sunday morning. This first test was designed to uncover minor flaws in the procedure and give a general direction for the rest of the project.
The first problem that arose was having only one source distribute the pure tone. Initially, the keyboard was going to be used as the tone producer. It turned out that not all of the sound produced from the keyboard could be wired into the speaker system. The results were two sources, beat frequencies, and vibrato of the beginning pitch. To remedy this flaw, a tone generator replaced the keyboard. Having a tone run directly through the sound systems without an outside musical source eliminated the issue of two sources yielding strange interference patterns like beat frequencies.
Secondly, the need for consistent, designated points was made evident. During this preliminary test, a tape measure was stretched down the center of the three isles. Data was recorded at five-foot increments. The difficulty that arose pertaining to consistency is that it was hard to perfectly align the tape measure each time it had to be moved to the next isle. This is where the idea of using string to form a grid over the auditorium was developed. Once the string was measured and in place, data could be recorded from each of the corners of the grid.
The third stumbling block that surfaced was how drastically decibel readings fluctuated when the meter was in contact with a human. When a person was in close proximity with the decibel meter, readings would vary substantially. The attempt to stabilize the decibel meter’s reading to acquire more accurate data came in the form of a procedure involving the stand for the decibel meter and for the person conducting the project to be as far away as possible. After the trial test was completed, adjustments were made to fix the discovered flaws before the testing began.
The first speaker position tested consisted of the main cluster of speakers in the Boones Ferry Community Church auditorium. This test served primarily to determine the current acoustical state of the auditorium without altering any of the speakers or objects.
The results of the low frequency (150Hertz) test showed sharp drops in intensity behind the columns. The columns are acting as a shield to the sound waves and cast a type of sound shadow behind the larger objects.
The medium frequency (440 Hertz) had some of the same problems as the low frequency. Sound shadows were detected around the two sets of columns. There were also significant drops of intensity around the chandelier style lights.
The high frequency (1000Hertz) had the least amount of problems out of the three partially due to a shorter wavelength. The change of sound intensity was not as drastic around the columns compared to the other two frequencies. However, there were some decreases of intensity detected around the lights.
After reviewing the data from speaker position #1, it was decided to remove the two large, hanging objects from the front of the auditorium. The intensity drops around the lights from speaker position #1 could be partially due to the absorption of the lights themselves and to the reflection of sound off of the hanging objects. It was possible that the hanging objects were reflecting the sound waves and not allowing the even dispersion of sound behind them.
Speaker position #2 still had the main cluster of speakers as the source of sound. The major difference was that the two hanging objects were removed to create fewer obstacles that the sound waves would encounter. The goal was to minimize the intensity drops through the center of the seating areas.
The low frequency again showed pronounced drops of intensity around the columns. The sound shadows around the columns actually decreased more drastically for the low frequency than it did for the same frequency in speaker position #1.
Like the sound shadows cast by the low frequency, the medium frequency unfurled the same results around the columns. It had bigger drops of intensity that the previous speaker position. However, the problems with fluctuating intensity through the middle of the main seating area were minimized.
The high frequency possessed the same improvements as the medium frequency. The sound was much more evenly distributed through the main seating area. Not all the problems were remedied for the high frequency in the speaker position. There still remained a marked difference in the intensity around the columns in the auditorium.
The good points to the previous speaker positions needed to be meshed together to form a speaker configuration that would not only keep the good qualities, but improve the bad. Speaker position #1 and #2 both had problems with sound shadows around the columns. Speaker position #2 had greater fluctuations of sound around the columns, but distributed the sound more evenly everywhere else. The objective for speaker position # 3 was to reduce the sound shadows revealed from the past two tests while maintaining even dispersion through the main seating area.
The third speaker position consisted of three smaller speakers placed at the head of the three isles (right, left, and center isle). The purpose of the two speakers of the outer isles was to direct sound waves behind the columns to the trouble spots. The speaker in the center isle was designed to maintain even dispersion through the main seating area.
Sound shadows around the columns were not quite as pronounced as preceding two speaker positions for the high and low frequency. The high frequency actually was distributed the most evenly throughout the auditorium of any of the speaker positions. The low frequency was much improved over the two other tests, but this speaker position could not be the solution because of the medium frequency.
The medium frequency ran into major interference patterns. Almost every other reading differed by ten to twenty decibels. The auditorium became a room full of clear troughs and crest of waves passing through the same space. If it were not for the major difficulties surrounding the medium frequency, speaker position #3 could have been a viable solution to create the most acoustically sound auditorium possible for Boones Ferry Community Church.
The three tested speaker positions all have certain qualities that a good speaker set up needs to possess. The least amount of sound shadow from position #1, the comparatively even dispersion of sound in the seating area of position #2, and the even dispersion results from the high and low frequencies of position #3, should all be present from a single speaker configuration to achieve the most satisfying sound in the Boones Ferry auditorium.
The ideal speaker configuration for any auditorium, including for Boones Ferry Community Church, is to have several sizes of speakers, and small speakers placed behind large sound barriers like columns. Various sizes of speakers can reproduce sound at a higher quality. Large speakers have the ability to propagate better sound in the low frequency range than a small speaker does. The best situation for an auditorium would be to have a wide variety of speaker sizes to accommodate all three frequency ranges. For example, since low frequencies are of higher quality when distributed from a large speaker and high frequency from a small speaker, a variety of speaker sizes are ideal in any auditorium. It is common practice in auditoriums to place small speakers behind large sound barriers to eliminate sound shadows and create evenly dispersed sound. For musical performance, having different sizes of speakers and placing speakers on sound barriers will enhance the overall qualities of the auditorium.
Theoretically, the ideal solution for the Boones Ferry Community Church auditorium would be to have a large speaker placed in the floor of the stage, the main cluster of speakers directly above the performer, and small speakers attached to the back of each column. Low frequencies have long wavelengths that can penetrate objects more efficiently than frequencies with shorter wavelengths. It is also more difficult to pinpoint the location from which a low frequency is emitted. This allows larger speakers to be placed within a floor or out of the way to leave more space on the stage. The main cluster of speakers would distribute the sound through the main seating areas and the small speakers would fill in the sound shadows behind barriers. Due to lack of resources available, the ideal set up for the Boones Ferry Community Church auditorium could not be accomplished during this project.
All the data and results gleaned from this acoustical analysis is perfectly accurate and applicable to an empty auditorium. When people are present, the acoustics of the auditorium will change because humans absorb and reflect sound. Anyone conducting an acoustical analysis of a room should bear in mind everything could be different when people attend the performance.
The acoustical analysis of the Boones Ferry
Community Church auditorium showed where sound shadows were a problem
throughout the room. The "dead spots" behind the columns and in the
main seating area were located and measured for their degree of severity. These
spots were attacked from many angles by different sizes and positions of
speakers. Each speaker position tested had some beneficial qualities, but there
was not one that fit all the specific criteria. However, progress was made in
the direction of improvements to this decade old complaint of musical
performers at Boones Ferry Community Church.
1. Giancoli, Douglas C., Physics: Principles with Applications, Third Edition; Prentice Hall, Englewood Cliffs, New Jersey 1991; pages 308-328
2. "Room Acoustics" January 12,1999 at
http://www.newformresearch.com/room-acoustics.html
3. "Teleconferencing Room Systems" August 4, 1996 at
http://www.gentner.com/Tech/tcom/TCONAcRmtreat.html
4. Hall, Donald E., Musical Acoustic: Second Edition; Brooks/Cole Publishing Company;
Chapter 15; August 25, 1997 http://www.thomson.com/brookscole/PROD_HTML/132480toc.html
5. Olson, Harry F., Music, Physics and Engineering; Second Edition; Dover Publications, Inc., New York 1967; pages 1-24, 242-324
6. "Cellular Approach for Modeling Room Acoustics: A Framework for Implementations Based on the Ray Tracing Algorithm" November 12, 1996 at http://home1.gte.net/dhillos/camra/abstract.html
7. Sources: Carey Stanlee and Randy Davy, partners in Davy-Stanlee & Associates
1. This is a model of reverberant characteristics of a room.
2. This link explains general concepts of sound, noise control as well as more specifics of room acoustics.
3. The think quest link gives basic information involving sound and its behaviors.
4. This link will take you on a very mathematical, almost mind boggling journey that measure sound by using a ray tracing algorithm.
5. Dr. Kevin Riggs from the Vibrational Holography Research at Stetson University has found a was to observe sound waves through their superposition on holograms. Check it out!
| HF1.txt | MF1.txt | LF1.txt |
| HF2.txt | MF2.txt | LF2.txt |
| HF3.txt | MF3.txt | LF3.txt |
Column one contains the results from the high frequency speaker positions, column two has the medium frequencies, and the last column is the low frequencies.