
| Table of Contents: | 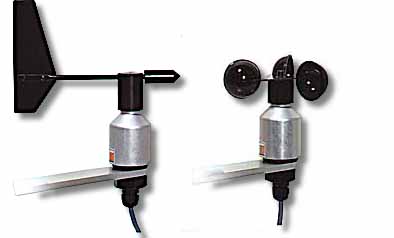
|
| 1) Introduction: | |
| 2) Background: | |
| 3) Objective: | |
| 4) Materials: | |
| 5) Procedures: | |
| 6) Errors: |
The anemometer is a probe(like the accelerometer and the motion detector) that measures the velocity of wind. Wind blown through the propeller causes the fan to rotate. By recording how many times the propeller passes a specific point inside the anemometer wind velocity is recorded in meters per second.
Wind is usually the term that is given to the natural horizontal motion of the atmosphere. The vertical motion is generally termed current. Winds are produced by differences in atmospheric pressure, which are primarily attributable to differences in temperature. Variations in the distribution of pressure and temperature are caused largely by unequal distribution of heat from the sun, together with other factors such as the thermal properties of land and ocean surfaces. When the heating of regions become unequal, the warmer air tends to rise and flow over the cooler air. Winds initiated in this manner are usually greatly modified by the earths rotation.
After searching the internet and learning from scientists like Marty Jones and numerous internet sources, I realized that there was a drastic range on the types of anemometers that can be purchased in the market. I couldnt believe how simplified some of the models were and how extreme others were. For an example the simplest one that I found was an anemometer that was created from just a piece of string, a protractor, and a pin pong ball. You would first attach the string to the middle of the protractor, and on the other end of the string attach the ball. You would position the sting to the protractor so that it started out on zero degrees, and as the wind blows on it, the angle that the string makes with the protractor is the velocity of the wind. A more complex model that you could either purchase or build would be one of the electronic ones where they not only measure the exact wind velocity, but temperature, direction, revolutions, and much much more. The more complex models have a devised ticker built into them that would measure the number of revolutions that the model makes. I took Mr. Murrays advice and devised a cupped anemometer with a ticker. My hypothesis was that if the car was going at a faster speed, then the more revolutions the model would make, which would indicate a higher wind velocity.
Through the ages weather forecasting were based on local observations made by the human senses. Accurate measurements of temperature and atmospheric pressure were not available until after the thermometer and the barometer were perfected in the 17th century. Comprehensive weather forecasting did not become practical until the telegraph was invented in the 19th century.
The first systematic weather observation in the United States dates back to 1738. In 1816 the German scientist Heinrich Brandes drew one of the worlds first known weather maps. Then in 1849 a man named Joseph Henry established a telegraphic network of observation for the preparation of daily weather maps.
One of the most common methods of weather forecasting today is synoptic forecasting. It is based on a summary of the total weather picture at a given time. The development and movement of weather systems is shown on a sequence of charts or maps. These weather systems then are projected into the future. The weather observations used for synoptic charts are made at thousands of weather stations around the world four times a day: at midnight, 6AM, noon, and 6PM.
Another method, statistical forecasting, employs mathematical equations based on examinations of the past behavior of the atmosphere. For forecasts of up to five days, numerical methods are most often used; for somewhat longer periods, statistical methods are more accurate.
Weve revolutionized so much that computer -drawn maps now predict wind, temperature, and humidity patterns for many atmospheric levels. Statistical methods are then used to map probable max. and min temperatures and precipitation.
When I first set out to do this physics project I thought that I would do my project on wind. I was interested in how wind actually worked and where it originated. I was always fascinated by wind and wanted to devise a model that would be capable of measuring the velocity of wind by comparing the number of revolutions the model made relative to the various speeds that the car traveled. To be truthful, I wasnt all that familiar with the properties of wind and how it worked. At first I had a hard time thinking up of a model that would be able to record the velocity until Mr. Murray gave me the idea of using a cupped anemometer.
I eventually found out that there were numerous errors in my data.
For one thing, wind in itself is not constant which makes it very difficult
to measure. I first started out driving in a parking lot and turned a lot
which would have contributed to the many errors. Scientist Marty Jones
suggested that I attach my anemometer to the roof of my car or something
so that it wont be shifting around as it would when somebody is holding
it, which would reduce the chances of errors. I personally have a very
difficult time trying to drive at the designated constant speed. Im sure
that I wasnt going at the required speed the whole entire time. The biggest
factor that effected my project was the fact that I live in Oregon and
thanks to Oregon rain I had to cut my project short. Internet sources emphasized
aluminum sheets to make the cups, but because they did not specify on how
thick the aluminum had to be, I decided to use cardboard. Cardboard tends
to be heavier and also they totally fall apart when introduced to rain.
Because of the extra weight that was introduced by the rain, my anemometer
did not turn as fast as I predicted at higher speeds. For some trials we
had to do it over and over because at a certain point it just didnt turn
at all. I think it is because of the extra weight caused by the rain and
because of the effect that rain has on wood with metal. Obviously it created
my friction once the wood was wet because I noticed that the model couldnt
turn as easily and became totally inefficient. (The Cups ended up getting
ruined and fell off) =(
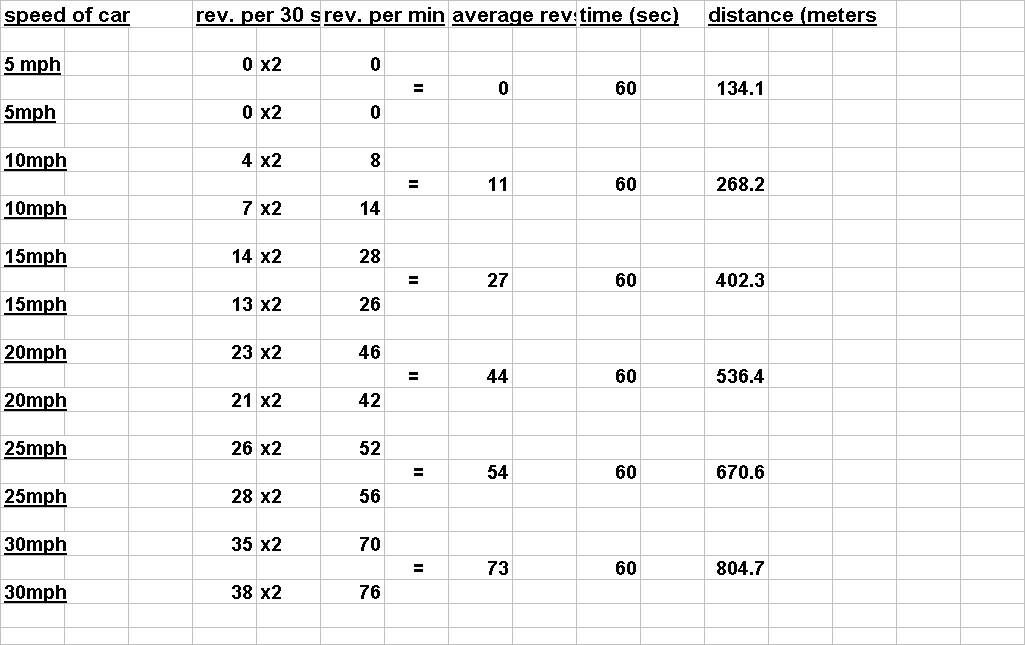
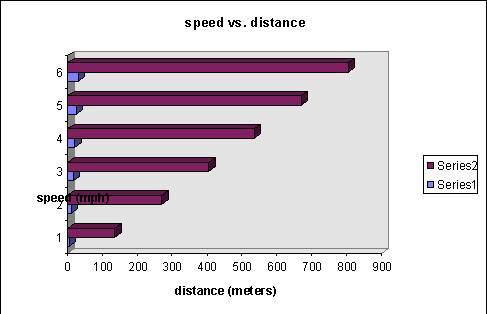
* I converted mph to m/sec, then I stuck that into the
speed = d/t formula and solved for the distance. Distance was not constant,
time was.
1) Anemometers: http://www.time-weather.com/time-weather/anemometers.html
2) Aeronautics: Making a Wind Anemometer: http://www.allstar.fiu.edu/aero/Experiment10.htm
3) Anemometer 840003: http://204.127.238.82/s840003i.htm
4) Weather Anemometer: http://208.161.180.245/ISk12mac/gsh/harness/_LIB/_MODELS/HOLLISTR/ANEMOMET.HTM
5) Anemometer: http://www.thiesclima.com/wind_e.htm
____________