The Correlation between Gauge Pressure and Paper Rocket’s Range
Benjamin Mangum
Table of Contents:
Introduction | Method/Procedure | Analysis | Results | Conclusion | Limitations and Improvements | Related Links | Bibliography | Return to Research
I have been launching paper rockets for many years; this activity has always been my favorite. I have especially enjoyed launching paper rockets using an air cannon; each Fourth of July my friends and I compete to see whose rocket will go the farthest. I always put care into constructing my rockets, making sure every detail, from the cone on top to the wing alignment, is as precise as possible. I always adore challenging my imagination’s limits and the structural integrity of others’ designs when I make and launch paper rockets. I am able to accomplish these feats with the help of an air cannon and air compressor.
The sole purpose of the air compressor is to increase the pressure and reduce the volume of a gas. With the air canon attached via hose, the air can project the rocket into the atmosphere. In order for the projectile’s launch to be successful, the rocket must have extra thick tape at the top of the cylinder (the body, where the cone will sit on top of) to ensure the projectile rocket will suffer no deformation upon impact. The air cannon is made of a storage tank, a quick exhaust valve, and the barrel. The storage tank is filled from the air compressor. The part of the cannon that makes it work so well is the quick exhaust valve. When triggered, the valve moves quickly to let the compressed air in the storage tank exit up through the barrel where the rocket sits. The air pressure from the tank then pushes the paper rocket off the barrel. Assuming no deformation of the rocket, I expect an elastic collision between the air and the projectile. In this collision, assuming energy is conserved, the stored energy of the gas in the tank gets converted into kinetic energy of the rocket. In this way the air propels the rocket high and far from the launch point, as the force of gravity acts to pull the rocket down to the earth.
Since air collides elastically microscopically, in
principle it would also be possible to calculate the trajectory of the rocket
using force and area and the pressure of the tank. However, the reason why I
did not take this approach was simply because this would be more difficult.
Again in principle, this can be done starting with the force on the rocket
exerted by air pressure in the cannon. Force is equal to mass by acceleration,
once the acceleration is known then the velocity of the rocket at takeoff could
be found using simple kinematic equations. Ideally the launch velocity could be
found with the following equation:![]() is the final velocity of
the rocket leaving the canon in
is the final velocity of
the rocket leaving the canon in![]() is the initial velocity of
the rocket launched in
is the initial velocity of
the rocket launched in![]() , a is the
acceleration of the rocket in
, a is the
acceleration of the rocket in![]() , and it is the time it takes air to leave the barrel in seconds.
, and it is the time it takes air to leave the barrel in seconds.
The part that makes this route a challenge is that
with a fixed amount of gas in the tank, once the valve is opened; the gas is released
and expands past the valve into the barrel. This means that during the launch,
the acceleration is not constant because pressure is not constant. Before
launch, the tank of the cannon is pressurized, but the barrel is not. After the
launch valve is opened, the gas travels and expands throughout the barrel, and
pushes the rocket off. Even when the rocket is halfway off the barrel, the gas
continues to expand. In this sense, the pressure is not constant. Since
pressure is not constant, neither is acceleration, they both change as a
function of time and so I do not have a good way to measure either variable.
Furthermore, the time of launch is very short. The time it takes for the force
of the gas to be exerted on the rocket is much less than one second, and I do
not have precise timing equipment to measure this time. Thus, the equation is
true, but because acceleration constantly changes and the time is difficult to
measure, this method is impractical. The equations for finding acceleration are
shown below:

Here, P is the pressure of the tank in Pa, F is the force exerted on the rocket in N, A is the area where the air pushes on the rocket in
Applied Physics:
Instead of using pressure and force, I took the route of using conservation of energy to calculate the velocity of the rocket as it is launched. The work done on the projectile rocket is known as the gauge pressure multiplied by the volume, and is related to the potential energy of tank, which can be expressed in these formulas:
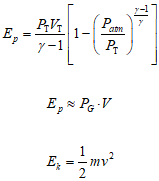
The first equation
represents the stored potential energy,![]() (in Pa) inside an air
tank -
(in Pa) inside an air
tank -![]() (gamma) is the adiabatic exponent or ratio of specific heats, and
is a constant of 1.4 for the diatomic gas air.
(gamma) is the adiabatic exponent or ratio of specific heats, and
is a constant of 1.4 for the diatomic gas air. ![]() - is
the pressure of the tank in Pa,
- is
the pressure of the tank in Pa, ![]() is the volume of the tank
in
is the volume of the tank
in ![]() , and
, and ![]() is atmospheric pressure in Pa. This equation was found
on Berkeley EH&S - University of California, and explains how to calculate
the stored energy of a pressurized gas vessel (link in bibliography).
is atmospheric pressure in Pa. This equation was found
on Berkeley EH&S - University of California, and explains how to calculate
the stored energy of a pressurized gas vessel (link in bibliography).
It can be assumed the
potential energy stored inside an air tank is roughly equal to the absolute
pressure subtracted by the ambient pressure. The second equation expresses this
showing potential energy,![]() in Pa, roughly equal
to gauge pressure
in Pa, roughly equal
to gauge pressure ![]() in Pa, and the
volume of the tank, V, in
in Pa, and the
volume of the tank, V, in ![]() . This can be assumed because if the pressure times the volume of
the tank (were to be separated by the rest of the variables (
. This can be assumed because if the pressure times the volume of
the tank (were to be separated by the rest of the variables (![]() x
x![]() , in Pa and
, in Pa and![]() ) in equation
one, then the total value would be extremely close to the pressure times the
volume of the tank. This is because if any value were plugged in for the
pressure and volume of the tank (including gamma), then we would get a value
very close to one (i.e. 0.96) for the bracketed equation multiplied by gamma
minus one. The third equation shows the work
done on the rocket, which is expressed as the kinetic energy of the rocket,
represented as
) in equation
one, then the total value would be extremely close to the pressure times the
volume of the tank. This is because if any value were plugged in for the
pressure and volume of the tank (including gamma), then we would get a value
very close to one (i.e. 0.96) for the bracketed equation multiplied by gamma
minus one. The third equation shows the work
done on the rocket, which is expressed as the kinetic energy of the rocket,
represented as ![]() in Joules, equal to one
half times mass (m) in kg, and velocity (v) squared in
in Joules, equal to one
half times mass (m) in kg, and velocity (v) squared in ![]() . The Work needed
to exert the air through the barrel is the same as the potential energy, and
due to the conservation of energy, the potential energy should equal to kinetic
energy. Because range is dependent on the velocity, all the variables must be
set to the velocity squared:
. The Work needed
to exert the air through the barrel is the same as the potential energy, and
due to the conservation of energy, the potential energy should equal to kinetic
energy. Because range is dependent on the velocity, all the variables must be
set to the velocity squared:
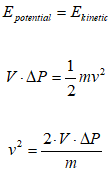
The
first equation shows kinetic energy of the rocket (![]() ) in J equal to potential energy in the pressurized vessel,
) in J equal to potential energy in the pressurized vessel,
After determining the value of ![]() , that value can
be substituted into the equation for range as shown below:
, that value can
be substituted into the equation for range as shown below:

Here g is the gravity constant (![]() ),
), ![]() is velocity squared in
is velocity squared in ![]() ,
, ![]() (theta) is the launch
angle in degrees,
(theta) is the launch
angle in degrees,![]() is the potential energy in J,
is the potential energy in J,
![]() is volume of the tank in
is volume of the tank in ![]() ,
, ![]() is the
gauge pressure of the tank in Pa, and the range
is the distance of the rocket launched in m.
is the
gauge pressure of the tank in Pa, and the range
is the distance of the rocket launched in m.
Problem:
The purpose of this investigation is to determine
the effect the air pressure has on the range of a projectile rocket fired from
an air compressor.
Hypothesis:
The relationship between
the air pressure of the tank and the range of the projectile will result in a linear
correlation. This theory seems to be true because velocity squared is
proportional to the gauge pressure inside the tank. I believe that the results
from this experiment will graphically present itself as a linear relationship,
(with range as the y-value and pressure as the x-value) and the graph between
range and velocity will be a positive quadratic relationship (with range as
y-value and velocity for x-value). If the relationship ends up not linear, the
real-world impacts of air resistance and drag, or non-elastic collisions would
be causes of this behavior. The constants include, but are not limited to: the
volume of the tank and the mass of the rocket. The pressure will be changed
intentionally to determine the range.
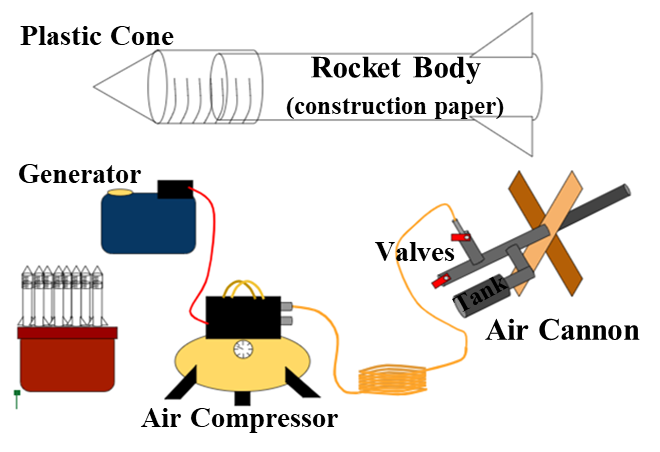
To collect raw data, the
procedure I went with was to create eight different rockets and test them
several times. To increase the durability of each rocket, construction paper
(9.5 x 11 inches) was rolled along a pvc
pipe the same diameter and circumference of the barrel (refer to diagram 1
below). Five layers of Scotch tape were applied along the top of the rocket and
a single layer held the body together. Fitting a plastic cone on the top was
part of the procedure. Finally, three small wings were taped onto the ends of
each rocket to increase probability in a stable flight. The reason for these
steps was to allow each rocket to be tested several times, and to account for
the different forces of drag that would be applied for each rocket. Two boards
of wood screwed into each other (at a ninety degree angle), and a hole was
drilled into the center so the air cannon could maintain its position during
launch, and hold a constant angle. As a generator would power the air compressor,
the air compressor would vacuum air into the tank, and transport air through a
hose into the air canon. Once the air compressor would show the desired
pressure, the valve attached to the chord would be closed (making the pressure
in the cannon be exactly equal to the pressure on the gauge). So once the
launch valve is opened, the exact amount of pressure is exerted on the rocket,
so a pressure range (i.e. 30-39 psi) would be tested eight times with the eight
different rockets.
There weren’t too many ethical concerns, since the
compressed air would be taken from the environment and re-released, so I was
avoiding exerting harmful emissions to the environment, and a valve on the
compressor would be released purposefully at the end of the experiment decrease
the chances of the tank exploding and causing any self-harm or damage to the
area. The way myself, and volunteers from my family were positioned allowed the
launch of the rockets to not launch straight at them or myself upon launch -
and although the generator ran on gas, we didn’t bring any fire starters or
matches to avoid any burns or gas explosions.
One ethical concern that was considered, however,
was if the location (with the least amount of elevation change) would be safe
for other individuals in the vicinity - and if rockets would land onto said
individuals, or enters the properties of others, endangering the health of
others and the experiment itself.
The independent variable was manipulated by
increasing the pressure within the tank. The air compressor allowed me to
vacuum in enough air when necessary, and transfer that pressure to the cannon.
To measure the dependent variable I had a volunteer from my family stand
parallel to the landing site of the rocket. Then I would use a rangefinder to pinpoint
the position of my sibling to give me the distance in yards. I also created a
homemade trundle wheel - with a radius of exactly 16.2 centimeters and a
circumference of one meter - made out of cardboard, scotch tape, a plastic cap,
a screw, a few washers, and a long piece of wood, to measure the distance of
the rocket. Twice, I used the trundle wheel to examine the accuracy of the
rangefinder by cross-checking the distances of the rangefinder in yards and the
trundle wheel in meters. I went along with different ranges of pressures
(between 10-20 psi, 40-50 psi, etc.) and would launch each of the eight rockets
every time. To my surprise, the rangefinder was quite accurate, as the graph
shows below.
Cross-Checked Data:
|
Range Finder (yd) |
yd → m |
Trundle (m) |
|
68.0 |
62.2 |
62.0 |
|
89.0 |
81.4 |
81.0 |
I Measured the dependent variable 59 times with
eight trials of eight ranges of pressure per 7 of the rockets, and three trials
for one rocket (rocket three broke after three trials, so it was discarded
accordingly).
I
chose this amount of variations because I was hoping to choose within the 59
data points 10 different ranges (with at least 3 trials each) to present
graphically by averaging the pressures with local ranges in close proximity to
each other. However, because each rocket experienced a different amount of
drag, most of the raw data would not match and fit. To group the data points, I
chose 4 different rockets that had the cleanest data (and didn’t have any
outliers) that would lead up to eight different ranges.
Diagram
1:
·
Paper
Rocket (Top Middle)
·
Generator
(Left)
·
Air
compressor (Bottom Middle)
·
Orange
Hose (Bottom Right)
·
Air
Cannon (Right)
·
Rocket
Supplies Box (Bottom Left)
Figure
1: Rangefinder

Figure
2: Homemade Trundle Wheel (roughly 16 cm radius, 1 meter circumference)

Analysis: (Text
Spreadsheets with Data: Sheet
1 Sheet
2) (Excel Spreadsheet) Top
Raw Data:
|
Rocket |
Range (m) |
Gauge Pressure (Pa) |
|
1 |
53 |
1.81E+05 |
|
1 |
90 |
3.40E+05 |
|
1 |
87 |
4.57E+05 |
|
1 |
80 |
2.43E+05 |
|
1 |
52 |
1.19E+05 |
|
1 |
84 |
3.47E+05 |
|
1 |
71 |
2.02E+05 |
|
1 |
36 |
5.61E+05 |
|
2 |
68 |
1.68E+05 |
|
2 |
99 |
3.40E+05 |
|
2 |
129 |
4.85E+05 |
|
2 |
90 |
2.78E+05 |
|
2 |
56 |
1.19E+05 |
|
2 |
111 |
3.54E+05 |
|
2 |
73 |
1.81E+05 |
|
2 |
135 |
5.74E+05 |
|
3 |
64 |
1.74E+05 |
|
3 |
112 |
3.47E+05 |
|
3 |
143 |
4.92E+05 |
|
4 |
63 |
1.88E+05 |
|
4 |
95 |
3.19E+05 |
|
4 |
116 |
4.85E+05 |
|
4 |
74 |
2.71E+05 |
|
4 |
59 |
1.26E+05 |
|
4 |
68 |
3.68E+05 |
|
4 |
64 |
1.95E+05 |
|
4 |
114 |
5.81E+05 |
|
5 |
71 |
1.74E+05 |
|
5 |
98 |
3.26E+05 |
|
5 |
130 |
4.92E+05 |
|
5 |
95 |
2.78E+05 |
|
5 |
55 |
1.33E+05 |
|
5 |
96 |
3.81E+05 |
|
5 |
79 |
2.02E+05 |
|
5 |
128 |
5.54E+05 |
|
6 |
58 |
1.74E+05 |
|
6 |
72 |
3.19E+05 |
|
6 |
87 |
4.64E+05 |
|
6 |
74 |
2.43E+05 |
|
6 |
48 |
1.33E+05 |
|
6 |
83 |
3.81E+05 |
|
6 |
63 |
2.09E+05 |
|
6 |
93 |
5.19E+05 |
|
7 |
78 |
2.09E+05 |
|
7 |
103 |
3.33E+05 |
|
7 |
59 |
4.64E+05 |
|
7 |
52 |
2.43E+05 |
|
7 |
55 |
1.40E+05 |
|
7 |
100 |
3.95E+05 |
|
7 |
76 |
2.09E+05 |
|
7 |
142 |
5.88E+05 |
|
8 |
81 |
1.95E+05 |
|
8 |
108 |
3.40E+05 |
|
8 |
131 |
4.85E+05 |
|
8 |
80 |
2.43E+05 |
|
8 |
62 |
1.40E+05 |
|
8 |
105 |
3.47E+05 |
|
8 |
81 |
2.09E+05 |
|
8 |
169 |
5.19E+05 |
Data
Table:
To process the data, I used the rockets that had the
cleanest results and a significant trend - rockets two, five, seven, and eight.
As part of the method, I converted yards to meters (multiplied each y-value by
0.9144) and Psi to Pa (multiplied each x-value by 6894.76) to give the results
in the preferred measurements. In ascending order, each point had four
pressures and four distances to average. Two outliers that affected the data
negatively were neglected, due to the rocket’s poor performances. I ended up
with eight different points with four trials each (two points with three
trials) and put them into the graph accordingly:
|
Pressure (Pa) |
Range (m) |
Range Uncertainty (m) |
|
1.33E+05 |
56.90 |
±3.70 |
|
1.87E+05 |
74.50 |
±6.90 |
|
2.00E+05 |
77.30 |
±4.10 |
|
2.66E+05 |
88.10 |
±7.80 |
|
3.35E+05 |
102.0 |
±5.00 |
|
3.69E+05 |
102.9 |
±7.30 |
|
4.87E+05 |
129.8 |
±0.900 |
|
5.59E+05 |
143.6 |
±20.6 |
To graph the results of the derived data, I used the
software Igor Pro to plot the following graphs. With range as my dependent variable
on the y-axis, and the gauge pressure as my independent variable on the x-axis,
the data was plugged into a data table, and a linear fit was applied to the
data, as shown below:

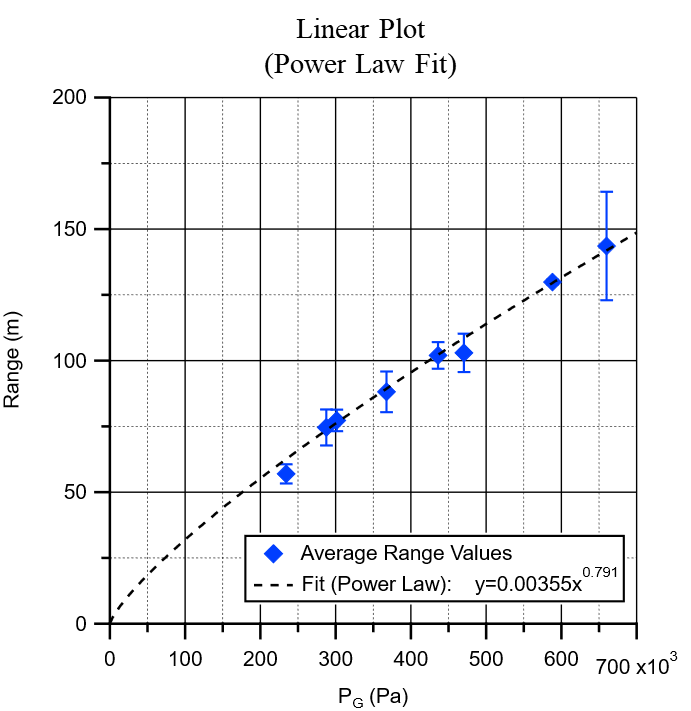
With the linear fit, the trend line has to go to the
origin, because in this case, negative pressure is a non-physical parameter. To
test if other functions would fit the data better, then, I graphed the data
with a power law fit as shown below:
I discovered the power law fit was better suited for
the derived data, thus I continued to analyze the data by using the log of each
data point with the power fit applied, then changing the fit to graphically
represent the derived data with a linear trend line. The graphs below show
this:

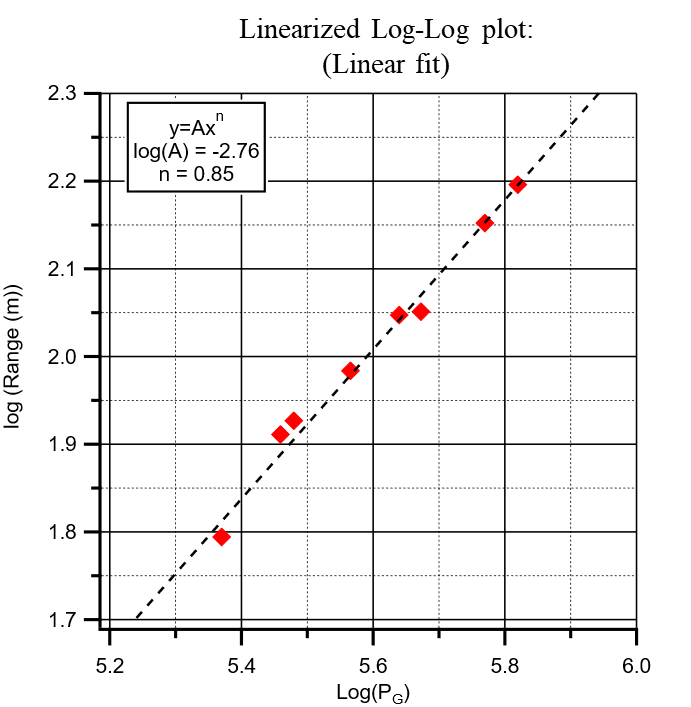
After using a log(x) vs.
log(y) function to further derive the data, I used the value of n in the
equation above to linearize the graph using the function
f(![]() ).
).
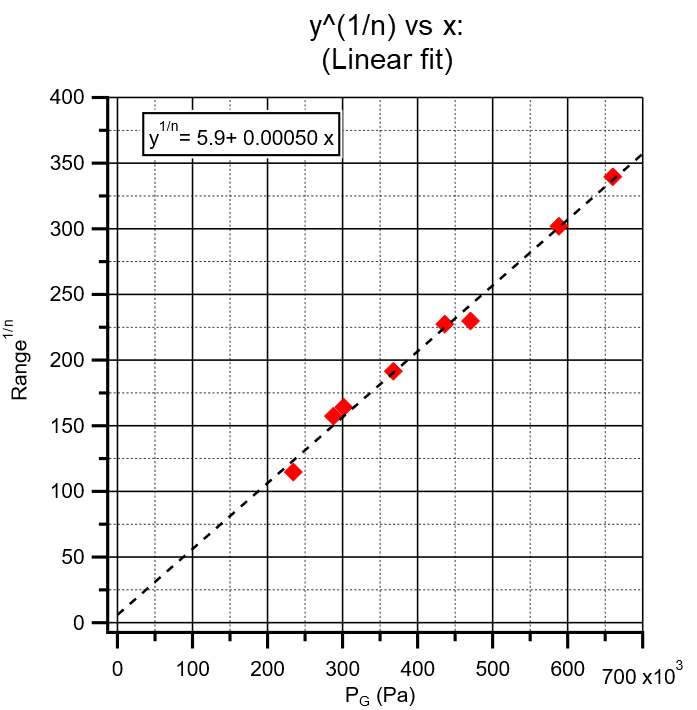
This graph shows the derived data linearized, or in this case, each y value was raised to the
power of one divided by the constant n. In this graph, n is equal to 0.85.
After completing my analysis, I applied the proper equations used from above
(refer to applied physics) and calculated what would have been the range based
on each pressure. The observed vs. calculated values were plugged into Igor Pro
and a linear fit was applied to test how accurate the equations were.

My original hypothesis predicted a positive linear
correlation between the change in air pressure and range, with the assumption
that energy would be conserved allowing an elastic collision so the projectile
rocket could follow projectile motion. By graphing the results of the
calculated range and the range from the derived data, the linear function y = mx + b gave me a function of 0.07x + 34.3. This meant only
7% from what I expected was achieved. Thus, the original hypothesis can be
discredited. The nature of the pressure increase and range increase was
contrary to the original prediction. I assumed that high pressurized air
would launch the rocket faster, and velocity (squared) was in equilibrium with
the potential energy (gauge pressure) multiplied by 2, and the whole product
divided by the mass of the rocket, so, velocity and pressure were linearly proportional,
thus the same could be said between pressure and range.
Rather than a linear
relationship, a power function was more directly correlated with the derived
data. I can interpret that from low pressures, there is a low air resistance
against the initial launch velocity of the rocket, however, at higher
pressures, the initial velocity would be much faster, and thus, the force of
air resistance on the rocket’s velocity would be much stronger. Consequently,
the range would start to decrease at higher pressures. The results of the data
also disprove my prediction that energy would be conserved, and that an elastic
collision between the final velocity of the pressurized air and the sealed tape
at the end of the rocket.
Limitations and Improvements: Top
Because
the energy output was proved to not be conserved, one source of error could be
that the release of air was not constant. Opening and closing the valves
required the use of human reaction, so it could be possible that the air would
be released at different times resulting in different velocities, or the valves
could not be closed entirely, so air leakage may have occurred.
Another
source of error could be the aerodynamics of each rocket, more specifically how
they were designed; although the masses are the same, the placement and bending
of the wings could change the direction and magnitude of the motion of launch,
resulting at a higher or lower distance from the measuring point.
Another
potential error could be the friction between the barrel and the rocket body -
the barrel is not frictionless, so a minute force of friction could affect the
rocket’s initial velocity at high pressures. However it is also important to
consider that in the early process of making the rockets, some extra space
could be left between the body and the barrel, where air could exit during
launch and not allow, to the most extent, full force exerted on the rocket.
As
part of the rocket’s design, another probable source of error is that some
rockets were less durable than others. Rocket three, for example, launched at a
high pressure, but performed quite well, and resulted in a long range - but to
my dismay, the cone broke, so the rocket had to be discarded. The cone most
likely broke upon impact (remnants of dirt were found inside) but the position
of the cone could have affected its durability due to the distance of the cone
being farther than usual than the mass.
In
order to minimize the sources of error, one method would be to use one rocket
made out of durable materials (such as plastic), so that the trajectory of the
rocket could be roughly the same, and that the design of the single rocket
would be as aerodynamic as possible. Another method to minimize the loss of
energy during the transfer of potential energy to kinetic energy,
would be to have automatic valves that would release the air at a constant rate
on command, although this is a more costly option.
To further investigate, I
could also measure the initial velocity (after immediately launching) of the
rocket in order to determine the loss of energy. A camera, although impractical,
could be useful in determining the initial velocity as the time would be given,
and I could calculate the initial velocity using basic kinematic equations.
However, if the experiment were to be repeated, I could use photo gates and
measure the initial velocity by launching each rocket with a card attached, and
observing how long it takes for the card to break the beam of the photo gates.
Acquiring a much larger field would also be preferable, so that the larger
space would allow for more trials associated with higher pressures, and would
account for the distance of the rockets.
· How air compressors work: https://www.bigrentz.com/blog/how-air-compressors-work, this website explains the physics behind an air compressor, what
technologies are used, and gives visual aid on how they operate.
· How atmospheric pressure affects rocket body: https://iopscience.iop.org/article/10.1088/1757-899X/608/1/012027/pdf, this study evaluates how the atmospheric pressure would affect the
trajectory, power system, pneumatic environmental design, structural and
institutional system, and other variables. The Pdf
describes in-depth changes in atmospheric pressure and how it affects a space
rocket’s launch.
· How
to build a paper rocket launcher: https://www.instructables.com/100-Yard-Paper-Rocket-Launcher/,
this website is a tutorial that explains how to make a simple rocket launcher
and paper rocket. Although the design is different from this experiment, the
principles are relatively the same.
· Factors
that help a rocket go farther: https://www.beyondthechalkboard.org/activity/paper-rockets-flying-farther/#:~:text=Angle%20%E2%80%93%20The%20
angle%20 at%20 which,as%20 measured%20on%20the%20ground, this is an instructional website for teachers on how to engage
students in rocket building, however, it also lists factors that affect a
rocket launch which are important to consider.
· Why aerodynamic
forces of rocket are proportional to pressure: https://www.grc.nasa.gov/www/k-12/rocket/dynpress.html, this website explains why dynamic pressure originates from, what
it is, and how it is conserved (essentially the pressure that allows the rocket
to launch).
·
Chi, Erik, Chen, Howard, Barkhuff,
Nick. The Physics of an Air
Cannon. http://tuhsphysics.ttsd.k12.or.us/Research/IB16/BarkChiChen/index.html
· Gankov, Lyubomir. An
Analysis of the Relationship between Air Pressure and Muzzle Velocity of an Air
Cannon. http://tuhsphysics.ttsd.k12.or.us/Research/IB16/Gankov/index.htm
· Berkeley
EH&S - University of California. Calculating the Stored Energy of a Pressurized Gas Vessel. https://ehs.berkeley.edu/publications/calculating-stored-energy-pressurized-gas-vessel