The Cartoon Water Tank Situation: Return to Research
Physics IA
Eric Blaettler
Tualatin High School
Word Count: 2052
Table of Contents
Method (Pg. 6-7)
Materials (pg. 6)
Introduction … Top
As a young kid something always fascinated me about cartoons. A leak would spring in a tank of water and water would gush out at high speeds, blasting away the character, and then the water would slowly trickle down into a slow dribble as the character walks back into the frame. I didn’t know how the water flowed out so fast, and I was unable to recreate this properly with a cup of water or a water bottle, so my question remained unanswered. In my physics class, I learned about Bernoulli’s principle which explained how a giant tank of water could have an initial rush of flow and then slow down as it drained more, it was its height. The equation made can also be modeled as its derivative, something else that heavily interests me as a math nerd.
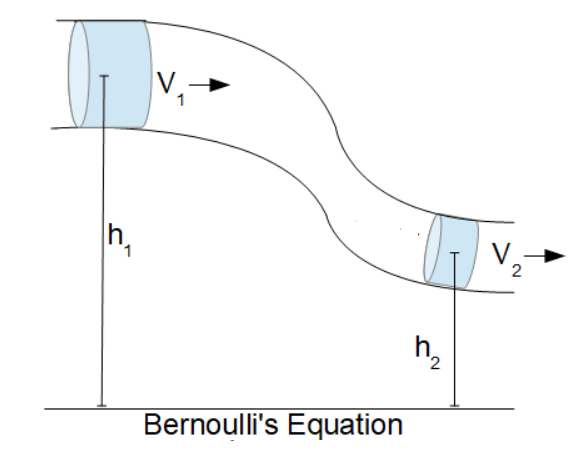
For this situation Bernoulli’s equation would be
set up as ![]() [1], where v is the velocity of the water, p is the density of the
water, g is the gravitational acceleration on earth(9.81)[2], and h is the height from the top of the water to the drain hole.
So as the water drains, the height of the water decreases and the velocity of
the water going out decreases as well. Since the velocity at the top is
much lower than the velocity of the water draining,
[1], where v is the velocity of the water, p is the density of the
water, g is the gravitational acceleration on earth(9.81)[2], and h is the height from the top of the water to the drain hole.
So as the water drains, the height of the water decreases and the velocity of
the water going out decreases as well. Since the velocity at the top is
much lower than the velocity of the water draining, ![]() is nearly
negligible in this equation[3].
is nearly
negligible in this equation[3].
![]()
![]()
![]()
Neglecting the velocity at the top can’t be used in all situations though, so this investigation will instead use the velocity at the top and the area of inside the bottle to get the most accurate calculation for flow rate.
![]()
This investigation will attempt to determine how
the height of water in a container determines its flow rate by finding the
relationship between the elapsed time and the height of the container. The
independent variable is time and the dependent variable is the height of the
water in the container. The controlled variables in this investigation are the temperature,
density, and viscosity of the liquid, and the height and diameter of the
container. I hypothesize that the container of liquid will have an initial rush
of flow out and then slow down as it drains more over time due to the height of
the water decreasing and reducing the potential energy. The rate at which
water flows out of the container will decrease as the height decreases, and
this decrease will begin gradually but will decay faster as the height further
decreases. The equation for the flow rate is similar to the equation of ![]() whose
graph has an initial growth rate that is high but then reduces as x increases.
Since this investigation uses a decreasing independent variable, the flow rate
will initially have a low decay rate, but as the height of the water decreases
the flow rate of the water will decay more rapidly.
whose
graph has an initial growth rate that is high but then reduces as x increases.
Since this investigation uses a decreasing independent variable, the flow rate
will initially have a low decay rate, but as the height of the water decreases
the flow rate of the water will decay more rapidly.
Graph of Derivative
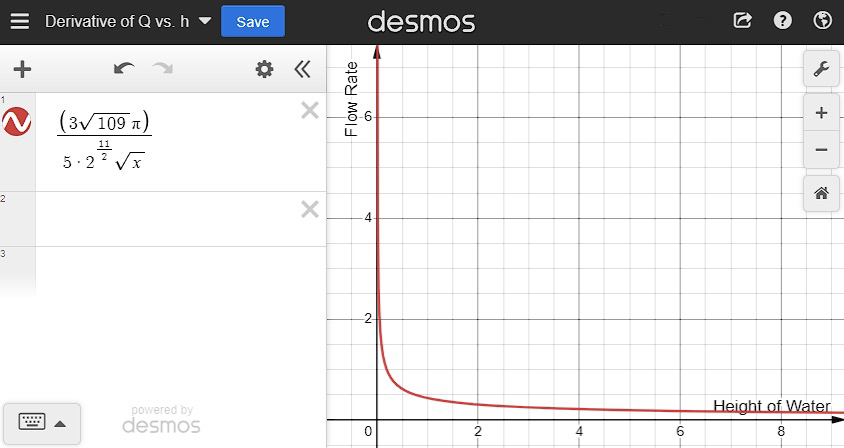
Graphing the derivative of the equation can
further support my hypothesis. As can be seen with the graph of the derivative
of ![]() , when the height is higher the change in flow rate is lower, but as
the height gets low, the change in flow rate is much higher.
, when the height is higher the change in flow rate is lower, but as
the height gets low, the change in flow rate is much higher.
Method … Top
Materials for my investigation include a one liter Smartwater brand plastic water bottle, a metric ruler to establish a scale, dyed water to make video analysis easier, a phone with a stand to hold it parallel to the water bottle, and the Vernier Video Analysis program to simplify the process of collecting data from video. The bottle has a hole with a diameter of 0.5 centimeters that is 2 centimeters up from the base in order to avoid potential displacement from the indentation on the base. The indentation will likely not cause much interference, but it is best to avoid any unnecessary variables.
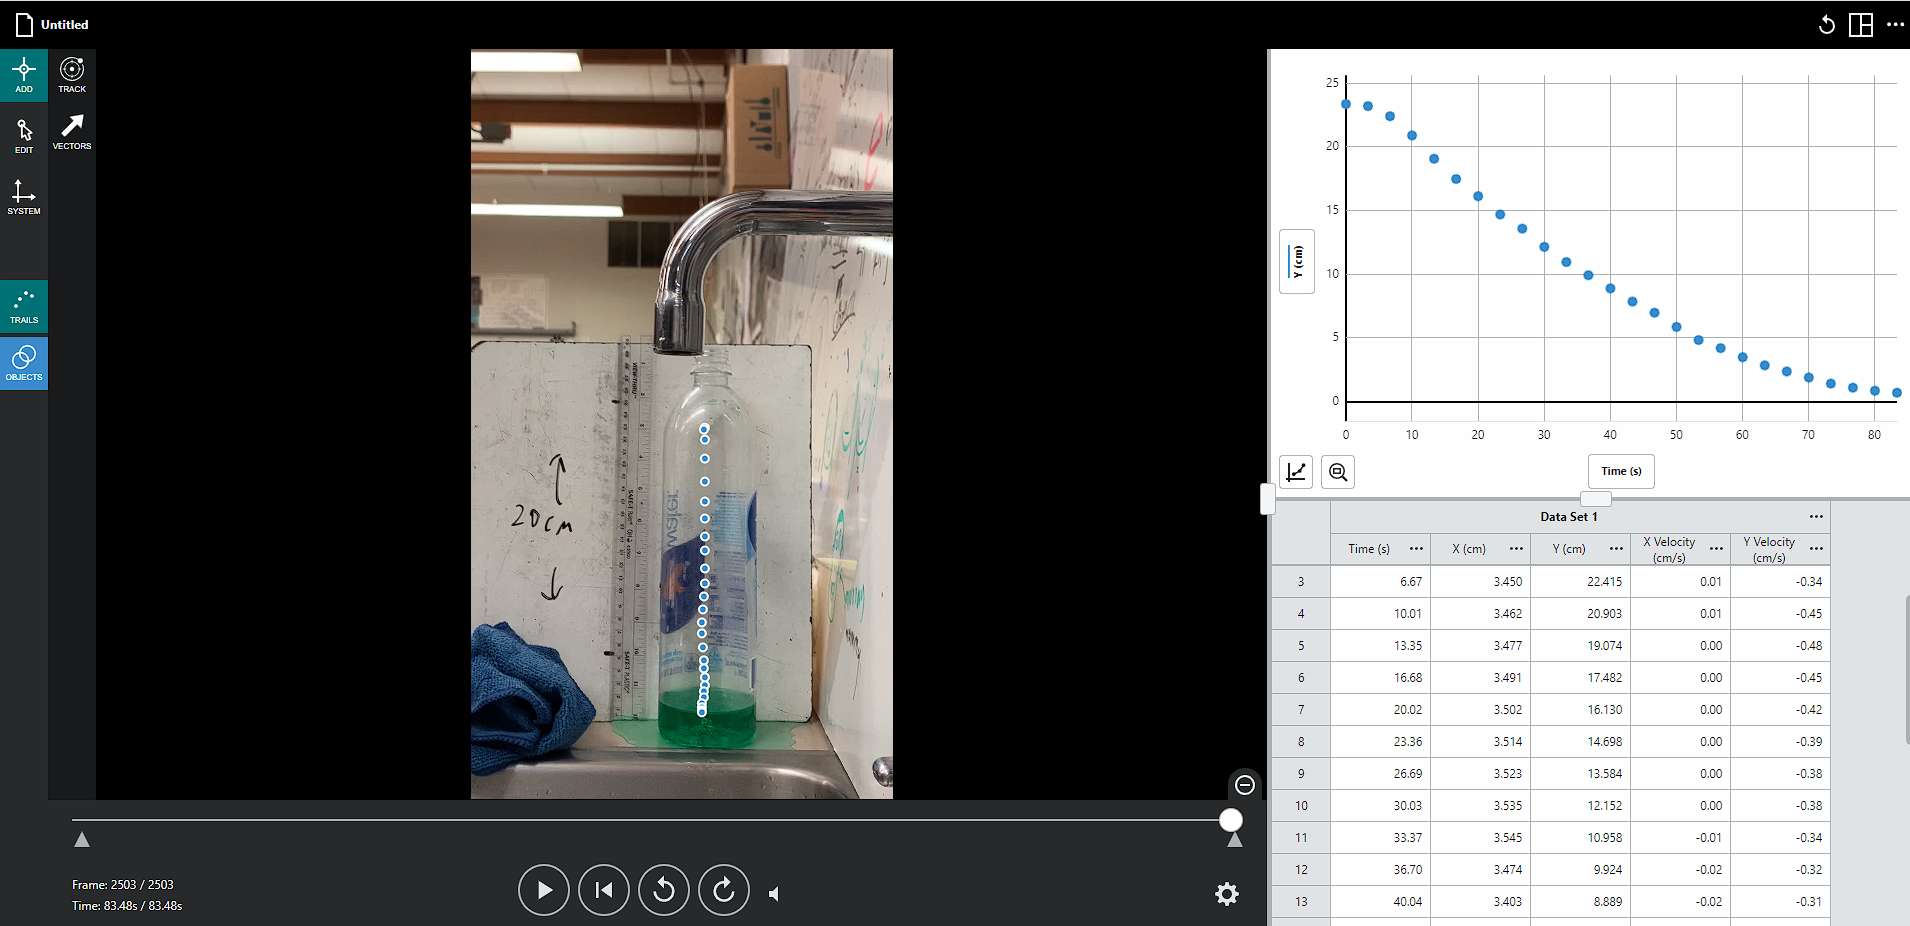
To conduct the experiment first I filled the water bottle up with water and then added dye in order for it to be more visible in the video. Due to the vacuum created, I was able to tighten the cap on the bottle to make the water not flow out of the hole. Then, unscrewed the cap of the bottle and recorded the water draining out until it started to slowly dribble out since the data collected after that wouldn’t be helpful in the investigation. Afterward, I downloaded my footage and put it into the Vernier Video Analysis program. This program allowed me to set a scale for the pixels in the video with reference to the ruler I put in the frame. From there I placed points of reference at every 100 frames which would create a total of around 25 frames of reference in the end. The Vernier Data Analysis program put all my data into a table which I could then move over into a spreadsheet which I could then use to graph my data. I then repeated this process two more times to have a total of three trials each with 24 to 31 points of variation. This variety of data points is due to the height of the water starting differently at each recording as well as human error during the video analysis section where I recorded points of data that wouldn’t be helpful for the investigation because they were so similar to the previous point. The results of three different trials could be averaged in order to neutralize the possible variation from the experiment, such as the starting height of the water. Doing around 25 different variations within the trials it would allow for a smooth graph in the end.
Example of Data Acquisition with the Vernier Data Analysis Program
Conducting this experiment does have the ethical concern of wasting water, so it is suggested that when repeating this experiment, collect and reuse the water for each trial. While my experiment only used around three liters of water in total, it is a good habit for any experiment where any resource can be reused instead of wasted.
The dependent variable of my experiment was the time elapsed and the independent variable was the height of water in the container. To measure the height of the water in the container I used the Vernier Video Analysis program in order to simplify the process, but noting the height of the water at second increments in a video would bring the same results, albeit more tedious. Variables that were controlled include the temperature, density, and viscosity of the liquid, the height and diameter of the container, the camera used, and the frame increment of the data collection. All of my experiments used room-temperature water from the same sink and four drops of food dye were added each time. This was all done to maintain the same density of the liquid in each trial. The same phone camera was used to record each trial in order to keep a consistent frame rate for the Vernier Video Analysis program so all the settings would remain constant and time increments would be the same.
Data … Top
|
Raw Data from Vernier Video Analysis |
|||||
|
Trial 1 |
Trial 2 |
Trial 3 |
|||
|
Time (s) |
Y (cm) |
Time (s) |
Y (cm) |
Time (s) |
Y (cm) |
|
0.0000 |
44.763 |
0.0000 |
34.049 |
0.0000 |
47.635 |
|
3.3350 |
43.336 |
3.3363 |
31.999 |
3.3356 |
45.751 |
|
6.6700 |
41.699 |
6.6725 |
30.585 |
6.6712 |
44.465 |
|
10.005 |
40.047 |
10.009 |
29.100 |
10.007 |
42.880 |
|
13.340 |
38.729 |
13.345 |
27.651 |
13.342 |
41.552 |
|
16.675 |
37.267 |
16.681 |
26.343 |
16.678 |
40.180 |
|
20.010 |
35.843 |
20.018 |
25.141 |
20.014 |
39.068 |
|
23.345 |
34.596 |
23.354 |
23.833 |
23.349 |
37.827 |
|
26.680 |
33.314 |
26.690 |
22.584 |
26.685 |
36.540 |
|
30.015 |
32.167 |
30.026 |
21.452 |
30.021 |
35.383 |
|
33.350 |
31.098 |
33.363 |
20.427 |
33.356 |
34.439 |
|
36.685 |
29.922 |
36.699 |
19.402 |
36.692 |
33.455 |
|
40.020 |
28.960 |
40.035 |
18.448 |
40.027 |
32.427 |
|
43.355 |
28.106 |
43.371 |
17.670 |
43.363 |
31.571 |
|
46.690 |
27.071 |
46.708 |
16.857 |
46.699 |
30.755 |
|
50.025 |
26.395 |
50.044 |
16.079 |
50.034 |
29.941 |
|
53.360 |
25.645 |
53.380 |
15.513 |
53.370 |
29.342 |
|
56.695 |
24.969 |
56.716 |
14.912 |
56.706 |
28.785 |
|
60.030 |
24.290 |
60.053 |
14.347 |
60.041 |
28.226 |
|
63.365 |
23.862 |
63.389 |
13.852 |
63.377 |
27.799 |
|
66.700 |
23.257 |
66.725 |
13.463 |
66.712 |
27.413 |
|
70.035 |
22.865 |
70.061 |
13.109 |
70.048 |
27.025 |
|
73.370 |
22.544 |
73.398 |
12.933 |
73.384 |
26.768 |
|
76.705 |
22.365 |
76.734 |
12.791 |
75.285 |
26.683 |
|
80.040 |
22.187 |
80.070 |
12.721 |
||
|
83.375 |
22.187 |
83.406 |
12.650 |
||
|
86.710 |
22.187 |
86.743 |
12.615 |
||
|
90.045 |
22.115 |
87.643 |
12.615 |
||
|
93.380 |
22.080 |
||||
|
96.715 |
22.008 |
||||
|
100.050 |
22.008 |
||||
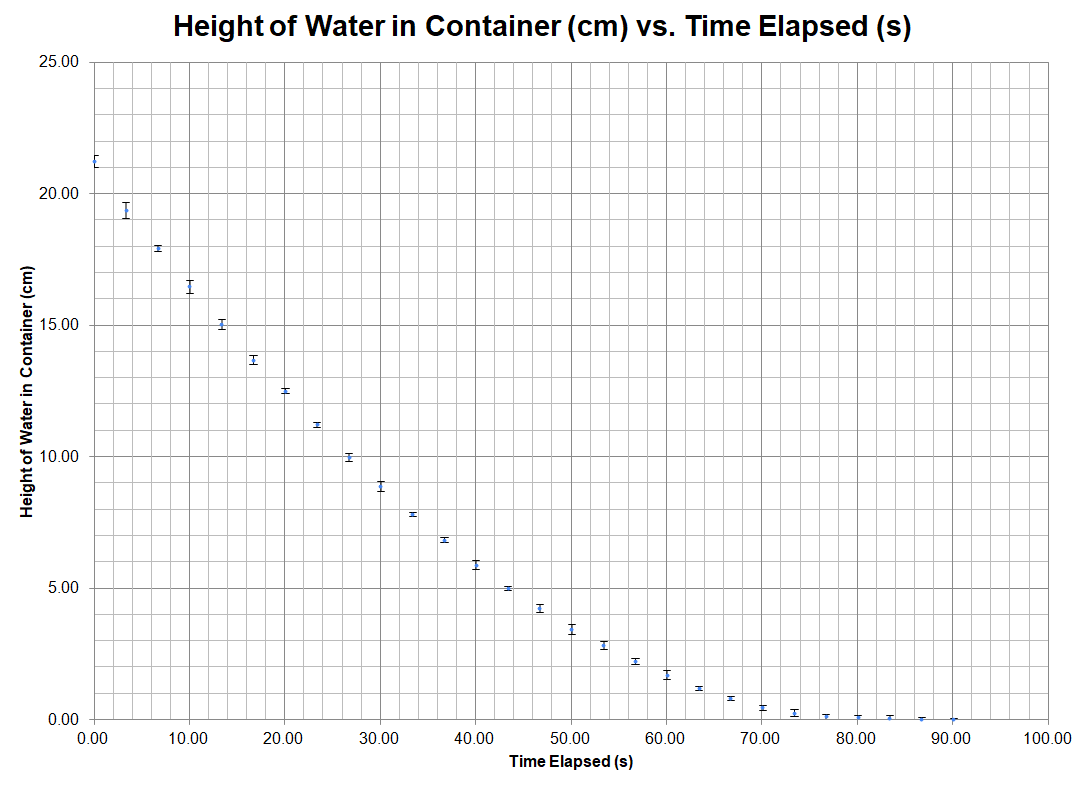
Raw data is
adjusted in order to have all trials start at similar heights, and to end with
zero. The last frame was adjusted as well in order to fit into time increments
of other trials and align with other trials. All trials are then averaged and
uncertainties are found.
|
Time |
Height of Water in Container |
||||
|
+/- .03 |
h / cm |
cm |
cm |
||
|
x / seconds |
Trial 1 |
Trial 2 |
Trial 3 |
Average |
Uncertainty |
|
0.00 |
21.33 |
21.43 |
20.95 |
21.24 |
0.48 |
|
3.33 |
19.69 |
19.38 |
19.07 |
19.38 |
0.62 |
|
6.67 |
18.04 |
17.97 |
17.78 |
17.93 |
0.26 |
|
10.00 |
16.72 |
16.49 |
16.20 |
16.47 |
0.52 |
|
13.34 |
15.26 |
15.04 |
14.87 |
15.05 |
0.39 |
|
16.67 |
13.84 |
13.73 |
13.50 |
13.69 |
0.34 |
|
20.01 |
12.59 |
12.53 |
12.39 |
12.50 |
0.20 |
|
23.34 |
11.31 |
11.22 |
11.14 |
11.22 |
0.16 |
|
26.68 |
10.16 |
9.97 |
9.86 |
9.99 |
0.30 |
|
30.01 |
9.09 |
8.84 |
8.70 |
8.88 |
0.39 |
|
33.35 |
7.91 |
7.81 |
7.76 |
7.83 |
0.16 |
|
36.68 |
6.95 |
6.79 |
6.77 |
6.84 |
0.18 |
|
40.02 |
6.10 |
5.83 |
5.74 |
5.89 |
0.35 |
|
43.35 |
5.06 |
5.05 |
4.89 |
5.00 |
0.18 |
|
46.69 |
4.39 |
4.24 |
4.07 |
4.23 |
0.31 |
|
50.02 |
3.64 |
3.46 |
3.26 |
3.45 |
0.38 |
|
53.36 |
2.96 |
2.90 |
2.66 |
2.84 |
0.30 |
|
56.69 |
2.28 |
2.30 |
2.10 |
2.23 |
0.20 |
|
60.03 |
1.85 |
1.73 |
1.54 |
1.71 |
0.31 |
|
63.36 |
1.25 |
1.24 |
1.12 |
1.20 |
0.13 |
|
66.70 |
0.86 |
0.85 |
0.73 |
0.81 |
0.13 |
|
70.03 |
0.54 |
0.49 |
0.34 |
0.46 |
0.19 |
|
73.37 |
0.36 |
0.32 |
0.09 |
0.25 |
0.27 |
|
76.70 |
0.18 |
0.18 |
0.00 |
0.12 |
0.18 |
|
80.04 |
0.18 |
0.11 |
0.00 |
0.09 |
0.18 |
|
83.37 |
0.18 |
0.03 |
0.00 |
0.07 |
0.18 |
|
86.71 |
0.11 |
0.00 |
0.00 |
0.04 |
0.11 |
|
90.04 |
0.07 |
0.00 |
0.00 |
0.02 |
0.07 |
To find the flow rate of water from the velocity
of water inside the container, the displacement over time is found by finding
the change in height and dividing it by the change over time. From there the
velocity can be imputed in the equation ![]() . Q is the flow rate, and A
is the area of the drain hole. In this table the velocity for the height of
21.24 cm. should be zero, but the bottle was already draining by the time the
data was collected. In this situation, that height will be ignored.
. Q is the flow rate, and A
is the area of the drain hole. In this table the velocity for the height of
21.24 cm. should be zero, but the bottle was already draining by the time the
data was collected. In this situation, that height will be ignored.
|
Time |
Averaged Water Height |
Velocity Inside The Bottle |
Flow Rate |
Flow Rate Uncertainty |
|
+/- .03 |
||||
|
x / seconds |
h / cm |
v / cms^-1 |
Q / cm^3s^-1 |
Q / cm^3s^-1 |
|
0.00 |
21.24 +/- 0.24 |
|||
|
3.33 |
19.38 +/- 0.31 |
0.56 +/- .01 |
21.46 |
0.31 |
|
6.67 |
17.93 +/- 0.13 |
0.43 =/- .00 |
16.71 |
0.05 |
|
10.00 |
16.47 +/- 0.26 |
0.44 =/- .00 |
16.90 |
0.08 |
|
13.34 |
15.05 +/- 0.20 |
0.42 =/- .00 |
16.29 |
0.05 |
|
16.67 |
13.69 +/- 0.17 |
0.41 =/- .00 |
15.81 |
0.04 |
|
20.01 |
12.50 +/- 0.10 |
0.36 =/- .00 |
13.68 |
0.02 |
|
23.34 |
11.22 +/- 0.08 |
0.38 =/- .00 |
14.76 |
0.01 |
|
26.68 |
9.99 +/- 0.15 |
0.37 =/- .00 |
14.14 |
0.02 |
|
30.01 |
8.88 +/- 0.20 |
0.34 =/- .00 |
12.93 |
0.03 |
|
33.35 |
7.83 +/- 0.08 |
0.31 =/- .00 |
12.08 |
0.01 |
|
36.68 |
6.84 +/- 0.09 |
0.30 =/- .00 |
11.45 |
0.01 |
|
40.02 |
5.89 +/- 0.18 |
0.28 =/- .00 |
10.89 |
0.02 |
|
43.35 |
5.00 +/- 0.09 |
0.27 =/- .00 |
10.28 |
0.01 |
|
46.69 |
4.23 +/- 0.16 |
0.23 =/- .00 |
8.85 |
0.02 |
|
50.02 |
3.45 +/- 0.19 |
0.23 =/- .00 |
9.02 |
0.03 |
|
53.36 |
2.84 +/- 0.15 |
0.18 =/- .00 |
7.08 |
0.02 |
|
56.69 |
2.23 +/- 0.10 |
0.18 =/- .00 |
7.08 |
0.02 |
|
60.03 |
1.71 +/- 0.16 |
0.15 =/- .00 |
5.96 |
0.03 |
|
63.36 |
1.20 +/- 0.07 |
0.15 =/- .00 |
5.88 |
0.02 |
|
66.70 |
0.81 +/- 0.06 |
0.12 =/- .00 |
4.48 |
0.02 |
|
70.03 |
0.46 +/- 0.10 |
0.11 =/- .00 |
4.09 |
0.04 |
|
73.37 |
0.25 +/- 0.14 |
0.06 =/- .00 |
2.35 |
0.05 |
|
76.70 |
0.12 +/- 0.09 |
0.04 =/- .00 |
1.56 |
0.05 |
|
80.04 |
0.09 +/- 0.09 |
0.01 =/- .00 |
0.27 |
0.01 |
|
83.37 |
0.07 +/- 0.09 |
0.01 =/- .00 |
0.27 |
0.01 |
|
86.71 |
0.04 +/- 0.05 |
0.01 =/- .00 |
0.41 |
0.02 |
|
90.04 |
0.02 +/- 0.04 |
0.00 =/- .00 |
0.14 |
0.01 |
At zero seconds the velocity cannot be found with the data collected because there exists no reference point before it to calculate displacement over time.
![]()
Diameter of bottle: 7 cm.[5]
![]()
![]()
![]()
![]()
![]()
![]()
![]()
Since the uncertainty of area is a constant, all that needs to be done is to multiply the uncertainty of velocity by the area of the inside of the bottle.
v=.56 +/- 0.01 cms^-1.
A=![]() cm.^2
cm.^2
0.01 * ![]()
![]()
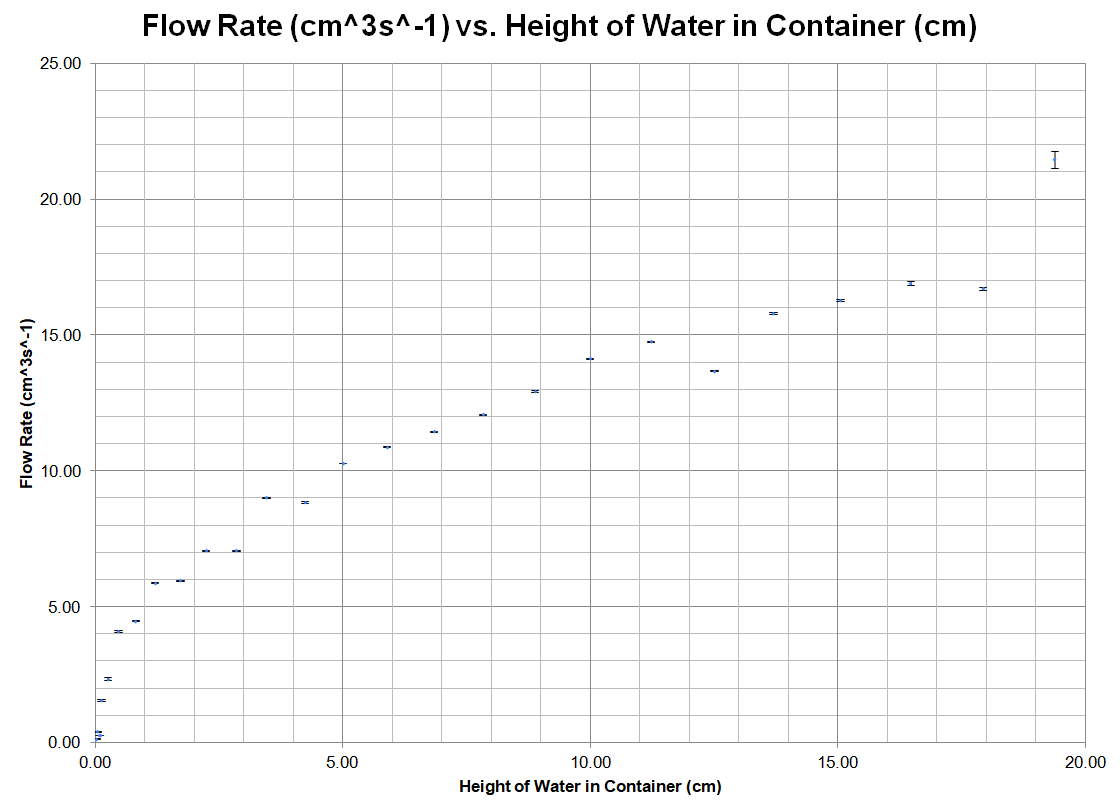
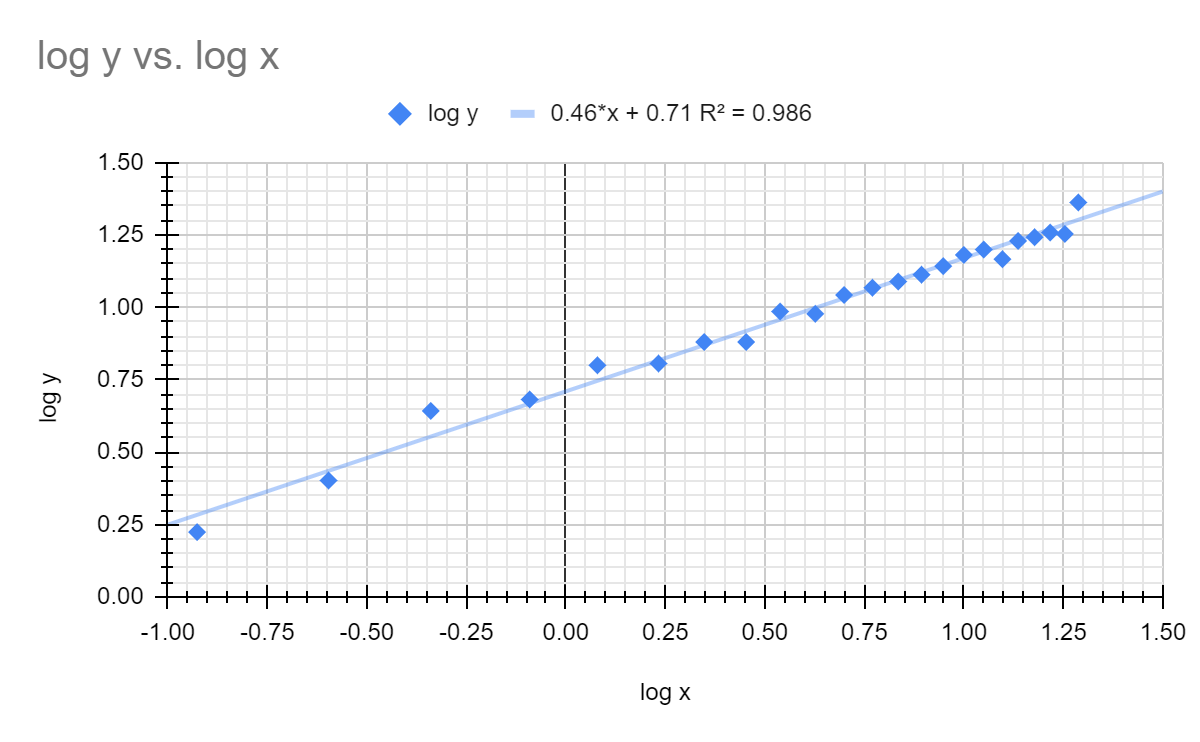
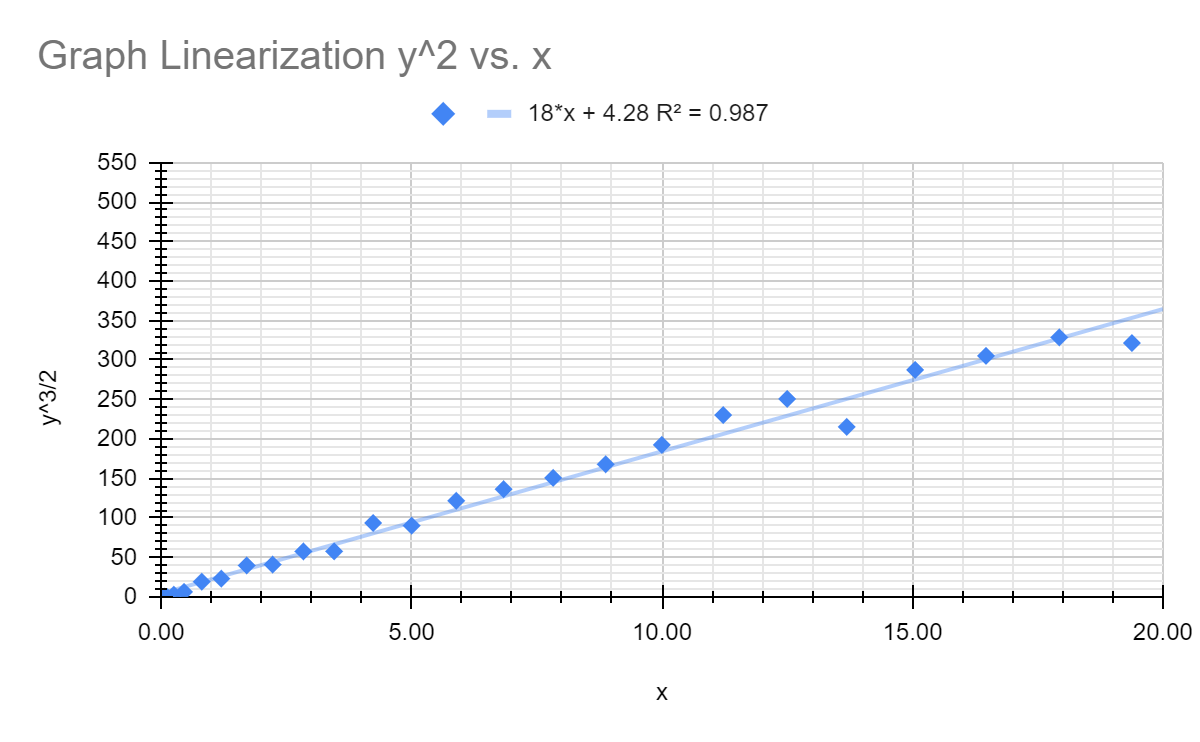
This is an attempt to linearize the data to understand the relationship between height and flow rate. In these graphs, x is the height of the water inside the bottle and y is the calculated flow rate.
![]()
![]()
![]()
![]() )
)
Conclusion … Top
By looking at the data collected in the investigation, a conclusion can be drawn that supports my hypothesis. As seen in the graphs for flow rate, the flow rate decreases as the height decreases, and the decrease gets more intense as the height approaches zero. From 20 cm. to 5 cm. the line trends linearly, but once the height decreases past 5 cm. the slope rapidly increases. This change in slope is shown by a large decrease in flow rate.
The reasoning behind the change in flow rate is best explained using conservation of energy and Bernoulli's equation. In this experiment, Bernoulli’s equation is set up as follows,
![]()
As stated in the introduction, this equation can then be simplified by removing unneeded variables since the height of the out hole would be zero and the velocity inside the bottle is much smaller than the velocity out.
![]()
![]()
What is left is a sequence of potential energy to kinetic energy. The potential energy being from the height of the water, and the resulting kinetic energy from the velocity the water drains out. As the water drains, the height will decrease, meaning that the potential energy in the sequence is lower, and kinetic energy will decrease as a result. Since velocity is the variable in the equation for flow rate, as the total energy in the sequence decreases, so will the flow rate.
Reflection… Top
This investigation is limited in its methods for data collection. While the Vernier Video Analysis program gets rid of most of the human error when it comes to recording data, the water was turbulent throughout the experiment and didn’t provide a stable line to reference in the program. Most of this turbulence was caused by the unscrewing of the cap to the bottle to release the vacuum. While being able to tighten the cap and create a vacuum in which the water wouldn’t flow out of the drain hole was helpful for transporting the bottle from the sink to where the experiment was conducted, it resulted in turbulence with the water inside the bottle. To reduce turbulence as much as possible, it would’ve been better just to cover the drain hole until the water is still before beginning the trial. Additionally, this investigation could benefit from collecting the flow rate with a device in order to have data to compare with the flow rate calculation. I didn’t have access to the device needed to record this data, so all calculations had to be only theoretical. Even without this additional check, the calculations provide data which was to be expected with the investigation. Finally, Since all of the trials started at different heights, there exists a fair bit of uncertainty in this experiment. If I were to repeat this experiment I would measure each trial to the exact same amount in order to take away this uncertainty.
If I wished to continue research on this topic I would investigate the variable of viscosity in this experiment. Making assumptions from the knowledge I have, the more viscous the fluid the slower it would flow out. Something I’m actually really curious about is the data collected from a liquid less viscous than water because I can’t picture how different the flow would be to water. The ethical concern of wasting resources would be more relevant with this change because many fluids are more expensive than water and could do damage to the pipes. Overall, adding this additional variable to the experiments interests me a lot and I’m likely to go forward with this research if I find myself with freetime.
Bibliography… Top
Smits, Alexander J. “Bernoulli's Equation.” Princeton University. The Trustees of Princeton University, February 5, 1997. https://www.princeton.edu/~asmits/Bicycle_web/Bernoulli.html.
Hathcox, Kyle, Glenn Marsch, and David Ward. “Physics.” Union University, January 2003. https://www.uu.edu/dept/physics/scienceguys/2003Jan.cfm.
University of Colorado Boulder, LearnChemE. “Draining a Cylindrical Tank.” YouTube. YouTube, June 4, 2012. https://www.youtube.com/watch?v=oIg2SxjF_Mg.
Khan, Sal. “What Is Volume Flow Rate? (Article) | Fluids.” Khan Academy. Khan Academy, 2015. https://www.khanacademy.org/science/physics/fluids/fluid-dynamics/a/what-is-volume-flow-rate.
McMahon, Arthur. “Smartwater Bottle Review: Water Bottle Review.” Backpackers.com, March 19, 2019. https://backpackers.com/outdoor-gear/reviews/smartwater-bottle-review/.
[1]Alexander J. Smits, “Bernoulli's Equation,” Princeton University (The Trustees of Princeton University, February 5, 1997), https://www.princeton.edu/~asmits/Bicycle_web/Bernoulli.html, 1.
[2] Kyle Hathcox, Glenn Marsch, and David Ward, “Physics,” Union University, January 2003, https://www.uu.edu/dept/physics/scienceguys/2003Jan.cfm, 1.
[3] LearnChemE University of Colorado Boulder, “Draining a Cylindrical Tank,” YouTube (YouTube, June 4, 2012), https://www.youtube.com/watch?v=oIg2SxjF_Mg, 2.
[4] Sal Khan, “What Is Volume Flow Rate? (Article) | Fluids,” Khan Academy (Khan Academy, 2015), https://www.khanacademy.org/science/physics/fluids/fluid-dynamics/a/what-is-volume-flow-rate, 1.
[5]Arthur McMahon, “Smartwater Bottle Review: Water Bottle Review,” Backpackers.com, March 19, 2019, https://backpackers.com/outdoor-gear/reviews/smartwater-bottle-review/, 1.
Related Websites… Top
https://demonstrations.wolfram.com/FlowFromATankAtConstantHeight/
https://phys.libretexts.org/Bookshelves/College_Physics/Book%3A_College_Physics_1e_(OpenStax)/12%3A_Fluid_Dynamics_and_Its_Biological_and_Medical_Applications/12.01%3A_Flow_Rate_and_Its_Relation_to_Velocity#:~:text=Flow%20rate%20Q%20is%20defined,v%20is%20its%20average%20velocity
https://lambdageeks.com/does-height-affect-potential-energy/
https://www.youtube.com/watch?v=A3dQRhiTQdM
https://en.wikipedia.org/wiki/Bernoulli%27s_principle