Measuring the Effect of Surface Area on the Velocity of a Skier
By: Hannah Gitt
Tualatin High School
Background I Problem I Hypothesis I Diagrams I Procedure I Data I Graph I Evaluation | Return to Research
Background
Skiing, specifically ski racing is one of those sports, often overlooked by many; however, it has become increasingly more popular over the decades. Ski races were originally used as a military event starting around the mid 1700s; however, with increasing popularity, the first non military ski race was held around the mid 1800s. This competition held in Oslo, Norway truly changed the skiing world and opened a whole new world for skiing enthusiasts.
While skiing was originally created as a means of transportation, and an ability to maneuver snowy areas at ease, the design and concept of skiing has evolved. From flat planks of wood to a combination of bent plastic, metal, and wood, skiing has gone from a transportation method to a fun activity.
The evolution of the ski has been taken from the various research done regarding which design is most aerodynamic, friction resistant, and sleekest. While the design of the ski does have an impact on the speed of a skier, it seems as though the body positioning of a skier has a greater affect than the shape or modifications of the ski. Through the evolution of the ski design, the evolution of skier dynamics also became relevant, as the technique the skier uses to maneuver downhill, directly affects the speed and efficiency. Many ski racers are often seen tucking down the hill as recreational skier most of the time do not have a very aggressive stance and just sort of stand up straight on their skis.
There is a lot of physics related topics in skiing, especially ski racing. The biggest topic in skiing is the position of the skier as they travel down the hill. There are other factors that may affect the speed at which the skier may go down a hill such as inconsistent winds or inconsistent body positioning or weight; however, the simple tuck can affect the rate at which a skier travels down a hill. while I am only covering one aspect of ski racing there are many others that involve physics, so the velocity at which a skier may travel down a hill may be affected by other things that just velocity, however for this experiment, I have chosen to uncover the base of the area of a skier and their velocity.
_______________________________________________________________________________________________________________________________________________________________________________________________
The intention of this investigation is to determine the relationship between the frontal area of a skier and their speed at the bottom of a hill. Wind resistance is measured by the velocity of the skier going down the hill. Skier speed is measured by the motion encoder on the cart, and the greatest value for the velocity is taken from the table. The variables of the experiment will include the independent variable, being the frontal area of the cart; the dependent variable being the velocity of the skier, and the constants being the wind speed, mass, and angle of elevation of the track
_______________________________________________________________________________________________________________________________________________________________________________________________
I believe that the less area a skier takes up, the faster the skier will descend down the hill. The less area a skier accompanies decreases the amount of air friction and allows the skier to descend at a faster rate.
Materials
Cardboard cut-out: sits atop the glider track, and acts as the surface area of the skier, adjusted to different heights
Fan: The fan acts as the wind resistance for the skier.
Tape: tape holds the materials together and secures them to the glider cart
Glider track and cart: The cart acts as the skier going down the hill and the track acts as the mountain
Straws: used to concentrate the wind on the surface area of the skier
Weights: placed on the cart to mimic the weight of a skier.
Computer: velocity of the cart is measured on the computer
Dependent Variable: speed of the glider track
Independent Variables: surface area of the cardboard cut-out
Constants: weight, wind
This model represents the cart traveling down the track with the fan on the right acting as the resisting wind force.
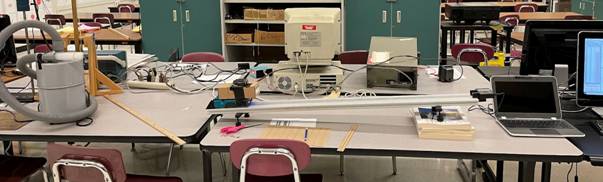
The image shows the set up of the air track and the glider with the weights and carboard cut-out on top, mimicking the autonomy of a skier.
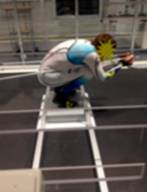
The images represent what experiment is meant to measure in real life, the degree of tuck of a skier as represented by these skiers, in an increased tuck.
_______________________________________________________________________________________________________________________________________________________________________________________________
Place the slide at a downward sloped angle, and tape a card to the car at the top of the slide. Place the fan at the bottom of the slide, facing the car, allow the car to fall down the slide and collect the data. For each round, cut a sliver of the card off and send it down the slide again. Repeat this step until there is only a small part of the card left. When removing pieces of the card, the minimum height that the cart would allow for was 5.6 mm, and the tallest height possible with the card was 32.6 mm. With this knowledge, I took ten different heights, starting with the two max and min heights and cutting pieces of the card to find measurements in between.
The controlled variables were wind, weight and angle of the track, and all of these variables remained constant throughout the entirety of the experiment and they were controlled by electrical sources, so there was not much room for human error.
_______________________________________________________________________________________________________________________________________________________________________________________________
|
Area (mm) |
Velocity (m/s) |
Uncertainty(m/s) |
|
694.38 |
0.560 |
0.024 |
|
|
0.538 |
|
|
|
0.513 |
|
|
|
0.549 |
|
|
|
0.556 |
|
|
630.48 |
0.616 |
0.023 |
|
|
0.579 |
|
|
|
0.571 |
|
|
|
0.569 |
|
|
|
0.577 |
|
|
566.58 |
0.673 |
0.018 |
|
|
0.638 |
|
|
|
0.650 |
|
|
|
0.673 |
|
|
|
0.663 |
|
|
502.68 |
0.728 |
0.019 |
|
|
0.690 |
|
|
|
0.718 |
|
|
|
0.698 |
|
|
|
0.695 |
|
|
438.78 |
0.753 |
0.015 |
|
|
0.756 |
|
|
|
0.733 |
|
|
|
0.763 |
|
|
|
0.763 |
|
|
374.88 |
0.848 |
0.011 |
|
|
0.862 |
|
|
|
0.850 |
|
|
|
0.840 |
|
|
|
0.848 |
|
|
310.98 |
0.923 |
0.009 |
|
|
0.931 |
|
|
|
0.919 |
|
|
|
0.936 |
|
|
|
0.937 |
|
|
247.08 |
0.977 |
0.007 |
|
|
0.988 |
|
|
|
0.982 |
|
|
|
0.974 |
|
|
|
0.981 |
|
|
183.18 |
1.008 |
0.011 |
|
|
0.997 |
|
|
|
1.014 |
|
|
|
1.006 |
|
|
|
1.018 |
|
|
119.28 |
1.026 |
0.007 |
|
|
1.038 |
|
|
|
1.025 |
|
|
|
1.024 |
|
|
|
1.026 |
|
Data Processing
I have chosen to attempt to find an equation that describes the data presented, and apply the numbers I have acquired from the built apparatus to acquire similar numbers to the graph. Since the equation may not work the same as the multiple trials, the equation should have a similar trend and slope. The numbers acquired should be fairly similar to those acquired from a real life skier if the values were multiplied by some scale. The lab model of the experiment is on a much smaller scale, so the data values collected follow the same pattern of minisculality.
Final Data
Averages:
|
Area (mm) |
Velocity (m/s) |
|
694.38 |
0.54083 |
|
630.48 |
0.58254 |
|
566.58 |
0.65934 |
|
502.68 |
0.70568 |
|
438.78 |
0.75346 |
|
374.88 |
0.84956 |
|
119.28 |
0.92932 |
Average uncertainty of velocity: 0.0143
In the graph, the max and min sort of show the range of values and how closely knit that values are.
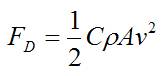
Looking at the graph, there is a strong, negative correlation amongst the data. This correlation means that the greater the frontal area, the smaller the velocity; meaning the more surface area a skier takes up, the slower they are going to travel down the hill. Similarly, in the hypothesis stated above, the less surface area a skier takes up, the faster they are going to go, seen by the correlation in the graph above. According to The Physics Classroom, “As the skier loses height (and thus loses potential energy), she gains speed (and thus gains kinetic energy).” As an attempt to find an equation to suit the experiment, the equation, which is listed below, mgh = 1/2mv^2 + Fs, meaning (mass)(gravity constant)(height) = (½)(mass)(velocity^2) + (force)(distance) was presented. While this equation may appear to be quite simple to calculate, there are indeed more parts to calculate as the force is needed to complete the equation and the equation for force is Force = (½)(drag coefficient)(density)(area)(velocity^2). Without having knowledge of the accurate density of the object or person, the equation has a fall through. In order to solve the equation, calculus would be needed to find a function, specifically since not all values would be constant either and a certain amount of error would need to be accounted for as well.
Limitations
This experiment turned out very accurate between data points; however, there are a few limitations to comparing this experiment set up to real life skiing. The scales are very different for the experiment and real life, so when things are shrunk significantly, the accuracy is decreased. Another limitation could be the wind source as I was only using a fan to blow wind at the cart; whereas, in real life there will be wind surrounding the skier instead of just a concentrated spot. There are also other factors in nature that may have not been as present in the lab experiment such as, ski friction, ski angle, and density. The error bars present on the graph above are very miniscule and almost negligible as the trials were very similar in outcomes, which may have been due to some of the other factors in nature that were ignored for the sake of the lab experiment.
Improvements
I believe the experiment was done to the best of our ability in the lab; however, I think it would be very beneficial to the accuracy of the experiment to conduct the experiment with a real skier in nature. With measuring a real life skier, there would be a lot more aspects to the experiment that are unable to be satisfied in the lab.
Sources:
https://olympics.com/en/sports/alpine-skiing/#:~:text=The%20first%20non%2Dmilitary%20skiing,new%20era%20of%20skiing%20enthusiasm. – gives information about the history of skiing.
https://www.real-world-physics-problems.com/physics-of-skiing.html - describes the different aspects of skiing that involve physics and connects the drag force equation.
https://www.hucksterslodge.com/blog/science-behind-skiing-faq/#:~:text=In%20downhill%20skiing%2C%20as%20your,skis%20and%20snow%20rub%20together. – provides information about some of the effects of snow on skis like the drag force
https://snowbrains.com/understanding-the-physics-of-ski-racing/ - shows how ski racing involves a lot of physics topics
https://aplusphysics.com/community/index.php?/blogs/entry/31137-the-physics-behind-skiing/ - shows how diffent types of skiing involve different physics concepts
https://untamedscience.com/blog/the-science-behind-the-fastest-skis/ - describes how to engineers figure out how to create a faster and smoother ski
https://www.sciencekids.co.nz/videos/sports/skiing.html - simplified physics concepts in skiing