The Effect Of Mass On The Period Of A Harmonic Oscillator: Introduction | Method | Procedure | Results | Errors | Conclusion | Bibliography | Return To Research
Simple harmonic motion is the “repetitive movement back and forth through an equilibrium, or central position, so that the maximum displacement on one side of this position is equal to the maximum displacement on the other side” (Britannica). In cases such as shock absorbers, the back and forth motion is created by the springs contracting (due to a bump, hole in the ground, etc) and then released as the car bobs up, and contracting again as the car falls back down, forming a repetitive movement back and forth through (with the equilibrium remaining constant relative to the spring, but changing as the car bobs up and down; the shock absorber, of course, is not affected by this as it moves too). A mass on a spring is also an example of a simple harmonic oscillator, and is ideal for data gathering. The interesting thing about the mass on a spring is that the period, which is one of the variables, does not change based on the amplitude (the length the spring was stretched to), nor does it depend on the gravitational constant (meaning that theoretically performing the experiment on earth should yield the same result as performing it on the moon, with the only difference being the equilibrium). In this experiment, the mass is what affects the period of said simple harmonic oscillator. So how exactly does changes in mass affect the period of a simple harmonic oscillator? The independent variable in this case would be the mass, as it doesn’t change due to any other variable. The dependent variable is the length of the period, as it depends on the mass. The control variable is the stiffness in the spring, as the same spring is used throughout the experiment. Before gathering data, I assumed that there was an exponential relationship, where the mass would increase the period by a growing factor every time the mass was increased (even if the mass was increased at a linear rate, which is the case for this experiment). However, after looking at the data, my current hypothesis is that an increase in mass would increase the period at a linear rate. This is intelligible because as I increased the mass in a linear fashion, inertia would also increase correspondingly; therefore, the resistance of change in motion would have to increase in a linear fashion as well, corresponding to the change in mass.
Though this experiment helped derive one of the founding equations in Physics, it is not particularly difficult to perform, and it does not require expensive machinery. Here is the method used:
Materials - A suspension item (such as a table, a ceiling, or in this case, a horizontal metal bar propped between two vertical metal bars), a spring (preferably with hooks at each end for ease of weight adjustment), a slotted set of removable weights with one base weight (50g) that has a hook attached, and a stopwatch
Diagram:
I started by selecting an adequate data range and interval. Because the investigation focuses on the effect of mass on the period, I found 20 variations with 5 trials each most adequate, prioritizing the number of variations due to the nature of the investigation (since the range of possible period length isn’t big, a lot of trials are not needed, but many variations should be integrated). The starting mass was 100g. I started out by ensuring that the appropriate weight was on, and then I pulled back the mass and the string, while having the stopwatch reset and ready. I started measuring a full cycle from the bottom, so once I let go I waited for it to reach the bottom to start the stopwatch. I counted in my head every time it would reach the starting position, and once the tenth time reached the bottom I stopped the stopwatch and divided the time that showed up on it by ten. This method was used to minimize human error, as simply starting and stopping after one cycle decreases the time to react (stop the stopwatch). I repeated this five times for every mass, adding 50g after the five trials were completed. The data was recorded in a spreadsheet. The contraption, as well as the spring, were kept the same as a constant. A safety concern was the unsecured weights, since if too much force was applied on the spring with a lot of weights, they could potentially detach from the hook and the momentum would be enough to injure someone. To minimize this risk, I made sure that not only did I not apply too much force on the spring, but also ensured that the opening to each weight (the weights were shaped in a circle, with an opening leading to the middle as to attach it on the hook) was on the opposite side of the weight above and below it. This ensured that even if one of the weights fell off, the other ones would not be dragged along with it.
Raw Data - Below is
a data table where 100 data points were collected, with the mass in grams as the
independent variable on the left, and period in seconds as the dependent
variable on the right
|
|
Period (s) vs Mass (g) |
||||
|
Mass (±0.2g) |
Period (s) |
±0.05s (Uncertainty) |
|
||
|
|
Trial 1 |
Trial 2 |
Trial 3 |
Trial 4 |
Trial 5 |
|
100 |
0.382 |
0.385 |
0.394 |
0.383 |
0.381 |
|
150 |
0.458 |
0.458 |
0.458 |
0.459 |
0.444 |
|
200 |
0.505 |
0.506 |
0.509 |
0.525 |
0.504 |
|
250 |
0.554 |
0.569 |
0.553 |
0.555 |
0.569 |
|
300 |
0.612 |
0.618 |
0.606 |
0.601 |
0.613 |
|
350 |
0.656 |
0.656 |
0.652 |
0.654 |
0.666 |
|
400 |
0.680 |
0.682 |
0.684 |
0.688 |
0.705 |
|
450 |
0.738 |
0.739 |
0.730 |
0.735 |
0.746 |
|
500 |
0.786 |
0.772 |
0.783 |
0.786 |
0.790 |
|
550 |
0.828 |
0.826 |
0.82 |
0.813 |
0.832 |
|
600 |
0.864 |
0.854 |
0.863 |
0.864 |
0.861 |
|
650 |
0.892 |
0.904 |
0.894 |
0.887 |
0.902 |
|
700 |
0.939 |
0.935 |
0.938 |
0.932 |
0.939 |
|
750 |
0.960 |
0.962 |
0.982 |
0.965 |
0.961 |
|
800 |
1.009 |
0.999 |
0.980 |
1.002 |
0.980 |
|
850 |
1.028 |
1.016 |
1.029 |
1.027 |
1.049 |
|
900 |
1.063 |
1.06 |
1.074 |
1.063 |
1.069 |
|
950 |
1.099 |
1.105 |
1.084 |
1.083 |
1.105 |
|
1000 |
1.141 |
1.127 |
1.135 |
1.12 |
1.122 |
|
1050 |
1.16 |
1.186 |
1.179 |
1.166 |
1.175 |
|
1100 |
1.217 |
1.208 |
1.257 |
1.231 |
1.226 |
Data Processing - The different trials are used to ensure that errors of any kind are minimized, and that outliers do not affect the results. In order to get a true data point based off of the trials, I had to average them using the following formula:
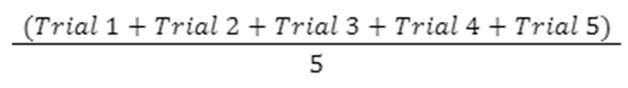
This process was repeated for every variation (different weight), and the data table can be seen below
|
Mass (g) |
Period (s) |
|
100 |
0.385 |
|
150 |
0.455 |
|
200 |
0.510 |
|
250 |
0.560 |
|
300 |
0.610 |
|
350 |
0.657 |
|
400 |
0.688 |
|
450 |
0.738 |
|
500 |
0.783 |
|
550 |
0.824 |
|
600 |
0.861 |
|
650 |
0.896 |
|
700 |
0.937 |
|
750 |
0.966 |
|
800 |
0.994 |
|
850 |
1.030 |
|
900 |
1.066 |
|
950 |
1.095 |
|
1000 |
1.129 |
|
1050 |
1.173 |
|
1100 |
1.228 |
I graphed this data table in order to visualize any trends; the trend for this data ended up being positively linear with a slight curve, perhaps as a sine function across the y = (7.92E-4)x (slope of the line).
From this trend one can see that with an increase in mass, the period increases as well. However, by taking the log from both the mass values and the period we can further linearize the data and determine if there is a constant relationship between the two measurements, or if they just follow a general trend without a specific constant
Data table with log calculated values:
|
Log Mass |
Log Period |
|
2.00 |
-0.41 |
|
2.18 |
-0.34 |
|
2.30 |
-0.29 |
|
2.40 |
-0.25 |
|
2.48 |
-0.21 |
|
2.54 |
-0.18 |
|
2.60 |
-0.16 |
|
2.65 |
-0.13 |
|
2.70 |
-0.11 |
|
2.74 |
-0.08 |
|
2.78 |
-0.06 |
|
2.81 |
-0.05 |
|
2.85 |
-0.03 |
|
2.88 |
-0.02 |
|
2.90 |
0.00 |
|
2.93 |
0.01 |
|
2.95 |
0.03 |
|
2.98 |
0.04 |
|
3.00 |
0.05 |
|
3.02 |
0.07 |
|
3.04 |
0.09 |
Log Graph
From this graph, we can determine that there is indeed a constant value, in this case approximately 0.484±0.15, by which the period increases based on the mass, not only allowing for predictable data acquisition but also proving Hooke’s Law, which is the foundation for the period of a mass on a spring equation mentioned below.
While this was not necessary to determine the impact of different masses on the period of a harmonic oscillator, the equation for mass on a spring must be mentioned:
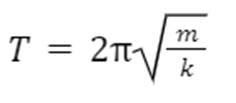
Where m is the mass, k is the spring constant, and T is the period
In fact, the period
can be determined by using the equation, but in this case I did not have the
value of the spring constant, so instead I used the equation to find it by
taking 5 different data points, finding the spring constant for each one of
them, and then averaging them out (note that I converted grams to kg for the
right unit to be applicable, ![]() ):
):
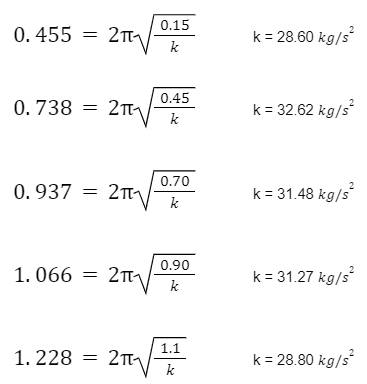
These were the constants for five data points spread throughout the set. Then I averaged them out using the same equation as the one for averaging the trials, except in this case I used the value of the constants rather than the value of the period for each trial:
![]() = 30.55 ± 2.2
= 30.55 ± 2.2 ![]()
With
this information, weights that were not measured in the experiment can now be
extrapolated
Errors contributing to the inaccuracy of this experiment cannot be overlooked,
as errors are present at any experiment, whether it’s done at a professional,
educational, or personal level. One of the most affecting variables was human
error. This mostly had to do with reaction time, and imperfect estimation of
start and stop positions. However, a personal detail in my life may have
unintentionally contributed beneficially to this experiment. I started playing
video games at a very young age, and though this does not directly aid to the
experiment, it has been proven that certain fast paced video games require not
only great, evolving problem solving skills, but also improve reaction time (ncbi.nlm.nih.gov). This can be seen in
variation 2 (150g) trials 1-3, where the recorded data is the exact same to the
tenth millisecond (before dividing by ten). Another significant error, though
not as impactful as human error, were technical errors. For example, the spring
on the bar would twist, making the weight gain horizontal momentum, which was
not intentional and falsely increased the value of the period. While this only
happened some of the time, it is worth noting that human error also had
something to do with this, as despite said technical error if I pulled the
weight down perfectly vertically, this wouldn’t have happened at all. The least
significant error, though still worth mentioning, were natural errors, which
mostly consisted of air resistance and frequent walking near the experiment.
Based on the interpretation of the data, I determined that there is a direct
linear, positive correlation between increasing the mass and the value of the
period. This ended up disproving my original hypothesis, and supported my
second one. My original hypothesis was disproved due to the fact that there is
a direct correlation between weight and period, which can be proven using the
mass on a spring equation. It was interesting to find out that despite it being
seemingly important, the amplitude did not affect the value of the period. Same
can be said for gravitational force, especially since the experiment was set up
vertically.
Based on the limitations of this experiment, if I were to
redo it I would have a laser detection system for starting and stopping a
stopwatch, as well as mechanically pulling the weight downward so that swaying
would be impossible. Calculating the spring constant after the experiment is
performed in this manner would increase the accuracy of said spring and
minimize uncertainty. Furthermore, knowing the actual value of the spring
constant could be used to predict data before it was actually measured, so that
way a comparison and analysis can be performed. For a future experiment, other
simple harmonic oscillators such as a simple pendulum would be useful to
acquire more knowledge about harmonic motion.
Conclusively, the effect of mass on the period of a
harmonic oscillator is a linear, correlative increase
Links: https://www.ncbi.nlm.nih.gov/pmc/articles/PMC2871325/#:~:text=Here%20we%20review%20evidence%20that,various%20tasks%20beyond%20game%20situations
– NCBI Thorough Explanation On Hamonic Motion
https://www.britannica.com/science/simple-harmonic-motion
- Equations and Other Important Information On Harmonic Motion
https://www.khanacademy.org/science/physics/mechanical-waves-and-sound/simple-harmonic-motion-with-calculus/v/introduction-to-harmonic-motion#:~:text=Harmonic%20motion%20refers%20to%20the,weight%20bouncing%20on%20a%20spring
– Specifically For Mass On a Spring
https://en.wikipedia.org/wiki/Simple_harmonic_motion
- Wikipedia Information On Simple Harmonic Motion And Oscillators
https://www.youtube.com/watch?v=dQw4w9WgXcQ
– Best Physics Video (Must Watch)
Dye,
Matthew W G, et al. “Increasing Speed of Processing with Action Video Games.”
Current Directions in Psychological Science, U.S. National Library of Medicine,
2009, https://www.ncbi.nlm.nih.gov/pmc/articles/PMC2871325/#:~:text=Here%20we%20review%20evidence%20that,various%20tasks%20beyond%20game%20situations.
“Simple
Harmonic Motion.” Encyclopædia Britannica, Encyclopædia Britannica, Inc.,
https://www.britannica.com/science/simple-harmonic-motion.