Drag force vs. The angle of an inverted wing: Introduction
| Method | Procedure | Data
| Errors | Conclusion | Bibliography | Return to Research
Andrew Epp
Tualatin High School
Introduction: Top
Inverted wings, or forward swept wings, are often the topic of science fiction and are a novelty in Hollywood productions, but in reality how does such a wing work? Before World War II some gliders with forward-swept wings existed, and the NACA (the National Advisory Committee for Aeronautics) Langley Memorial Aeronautical Laboratory (now Langley Research Center) in Hampton, Virginia, performed wind-tunnel studies on the concept in 1931. Additionally, Germany throughout the Second World War would experiment with the concept creating a jet powered aircraft with forward swept wings, the Ju 287 (Dunbar).
NASA Scientist would eventually try the same in 1989 with the X-29 Program, they discovered air flowed in reverse when compared to the flow of air on aft wings. Contrary to the flow of air on aft swept wings that flows down to the tips of the wings, airflow on forward swept wings would flow towards the fuselage increasing lift (NASA).
Odd planes like the X-29 and the Soviet Su-47 have always fascinated me, the odd and rare wing design made me want to investigate the relationship between the angle at which a wing is pointed forward and the drag force that is produced. To measure this relationship I will attach a force probe to a frictionless glider with a wing mounted on top of the glider, making sure to use a single speed industrial fan to keep win speed at a constant when measuring the force relative to a specific angle. Examining the relationship between the two variables will be interesting and it is my current belief that the further the wing is angled forward the more force it will generate.
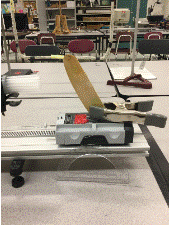
While performing this experiment I would set up a test bench to record data points of different variations. Each variation would gather the mean, max and min of the variation gathering 200 data points in five seconds per each variation. While setting up the test bench the materials I used consisted of: a frictionless track, frictionless cart, gorilla tape, a heavy duty metal clamp, an industrial fan, fishing line, a force probe connected to a computer with Windows Seven software, and an 11 inch Styrofoam wing.
Diagram:
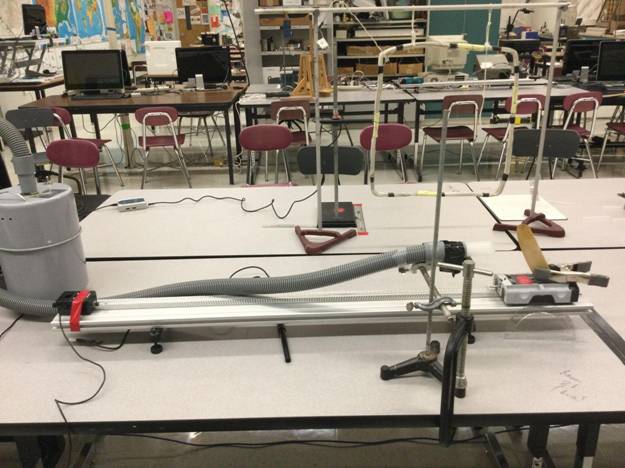
The first thing that was done to secure proper data was to make sure that the track was placed on a level surface. On the end of the track the force probe would be placed and secured with gorilla tape wrapped around the exterior portion of the track and probe. Attach one end of a 3 foot long fishing line to the hook of the force probe making sure that it is secured tightly with a knot before proceeding. Once finished, take the cart and the inter end of your fishing line; place half a large piece of gorilla tape in the middle of the cart making sure that only half of the tape is sticking to the carts surface, with the remaining length of tape fold it over so that the two ends of tape meet and stick together ensuring that the sticky side of the tape is now facing upwards.Place the metal clamp atop of the cart and ensure that when the styrofoam wing is inserted it is standing perpendicular to the cart and track. Fix the fan so that it is facing close to the wing and hitting the entirety of the wing. Connect the force probe to the windows ensuring that the proper software is used to monitor the data from the different variations. Use a protractor to ensure that the wing is standing at a 90 degree angle. Take the first data point by turning on the fan being sure to wait a couple of seconds giving the fan enough time to come up to speed. Once the fan has come up to speed press the spacebar on your computer’s keyboard to gather the data, once done highlight the data and copy it into a google doc. Be sure to gather data a total of 10 times using a protractor to measure how far forward you are moving the wing.
|
Angle in deg(°) |
Drag Force |
|
|
||
|
+/-.0.05 |
F/N |
|
|
||
|
x/deg |
Mean |
Min |
Max |
Average |
Uncertainties |
|
90 |
0.0213 |
-0.0403 |
0.0717 |
0.0175 |
0.0560 |
|
5 |
0.0168 |
-0.0219 |
0.0717 |
0.0222 |
0.0468 |
|
10 |
0.0266 |
-0.0157 |
0.0717 |
0.0275 |
0.0437 |
|
15 |
0.0183 |
-0.0278 |
0.1089 |
0.0331 |
0.0684 |
|
20 |
0.0283 |
-0.0094 |
0.1026 |
0.0405 |
0.0560 |
|
25 |
0.0784 |
-0.0466 |
0.0963 |
0.0427 |
0.0715 |
|
30 |
0.0454 |
0.0031 |
0.0963 |
0.0483 |
0.0466 |
|
35 |
0.0234 |
0.0403 |
0.1151 |
0.0596 |
0.0374 |
|
40 |
0.0226 |
-0.0157 |
0.0529 |
0.0199 |
0.0343 |
|
45 |
0.0192 |
-0.0157 |
0.0529 |
0.0188 |
0.0343 |
In order to process the data, multiple data points were
taken per each degree. By using computer simulations the data set above allowed
me to take 200 data points and average them out in a matter of 5 seconds,
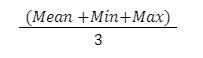
giving me the mean, max and min of each datapoint. Furthermore, in order to get
a datapoint suitable to graph I used the following equation to get the average
seen in the data table above:
This process was repeated for every single degree variation and is displayed in the following graph:
|
x/deg |
Average (N) |
|
0 |
0.01754 |
|
5 |
0.02218 |
|
10 |
0.02752 |
|
15 |
0.03314 |
|
20 |
0.04048 |
|
25 |
0.04272 |
|
30 |
0.04830 |
|
35 |
0.05963 |
|
40 |
0.01993 |
|
45 |
0.01878 |
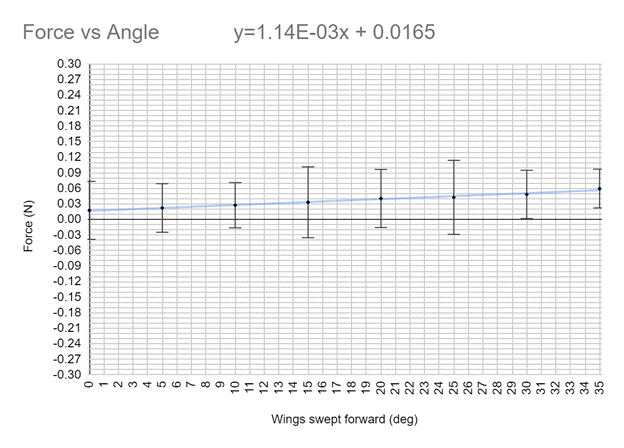
I would use these points to formulate a graph of the average values for visual purposes, the majority of the data seemed to be linear.
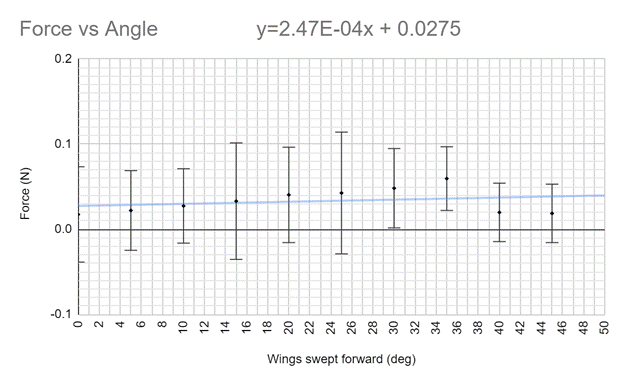
From this graph it is evident that the points remain fairly linear until the wings reach a forward pointing angle of 35°, from here I speculate that the surface area of the wing has decreased dramatically and caused the wing to produce less force overall after a certain point. With this information I isolated the points and calculated the new line of best fit.
|
x/deg |
Average |
|
0 |
0.01754 |
|
5 |
0.02218 |
|
10 |
0.02752 |
|
15 |
0.03314 |
|
20 |
0.04048 |
|
25 |
0.04272 |
|
30 |
0.04830 |
|
35 |
0.05963 |
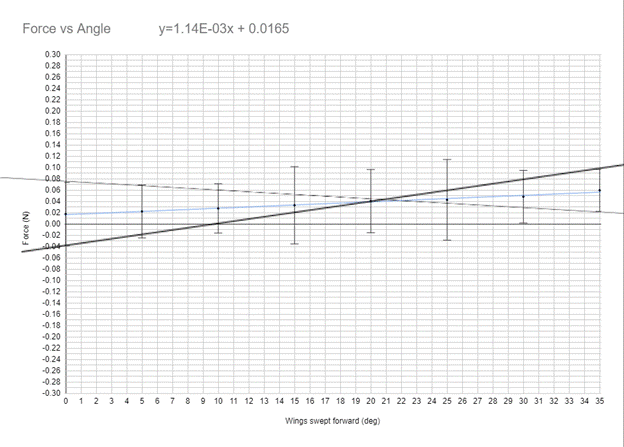
In order to further validate the data that I had gathered in the above graph I calculated the uncertainty of the slope and found that the points gathered had an uncertainty of +/- 0.0027 displayed in the following graph:
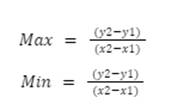
From here I was able to
calculate the uncertainty of the slope by using the equation:
I would then average the
two to get the final uncertainty of the slope by using the equation:
Therefore by using this
equation as follows I was able to discern the uncertainty of the slope to be
+/- 0.0027:
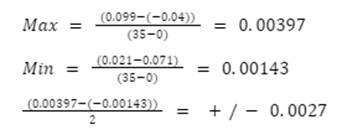
This proves that as the angle increases the amount of force that is produced increases to an extent. Additionally, the size of the uncertainty displays that the data collected is indeed accurate and validates the aforementioned statement.
Much like any experiment there are errors no matter what platform a science experiment is performed on, whether it be a professional or personal level there will be some sort of error that takes hold of any experiment. This experiment included. This is due to the method in which my data was taken. To increase the measurability of data, a rectangular piece of styrofoam was used to ensure that wind would hit and thus push the cart pack allowing for measurable force to be taken. Things such as turbulence could have hindered the data that was gathered as wind could have deflected off the wing inflating the various data points that were taken. This is seen with the sporadic uncertainties displayed in my data table and charts, this shows the sporadic nature or wind mechanics and turbulence in an open wind tunnel rather than in a closed and confined space. Which is yet another error that very well could have plagued this experiment. As the use of non laminar flow was used to record the data for this experiment this could have also induced more turbulence in the experiment. Furthermore, without a properly contained environment airflow could have been hindered by outside forces dispersing the flow of air even before it took a proper effect on the wing. That said, those aforementioned hindrances could very well be a part of the wings design as airflows in reverse creating the potential for the wing itself to create or be susceptible to more turbulence (NASA).
Based on the findings of this experiment I find that my hypothesis was to an extent wrong. The fact that lift can even more so be generated by continuing to angle the wing forward proved to be a fatal flaw in my hypothesis, as demonstrated by my graph, the amount of force that is produced caps out at a specific angle where the wing is no longer efficient or practical thanks to the way air flows around it. What surprised me about this experiment in particular was the rather linear nature of the force produced. I expected that the force produced would resemble that of a log graph rather than increasing at a linear level.
Were I to do this experiment again I would have taken more steps to reduce the potential for turbulence to occur in the experiment. This would include using a proper wind tunnel to track the results of airflow around the wing. Additionally, I would want to see how air flows around the wing. This would involve attaching some sort of ribbons or flags around the exterior of the wing to see how the air flows in parallel with the wing. Additionally I would rearrange the position of the wing from one of vertical position to a horizontal position that simulates flight more accurately.
In conclusion the effects of Drag vs the angle of an inverted wing remain correlated through positive linear relationship.
Links: Top
https://www.nasa.gov/centers/dryden/pdf/87965main_H-1199.pdf - X29 Research from NASA
https://www.youtube.com/watch?v=RN6vGxyMcVU - More about the existence of Inverted wings
https://www.wtamu.edu/~cbaird/sq/2012/12/17/how-do-airplanes-fly-upside-down-if-its-the-shape-of-the-wings-that-make-them-fly/ - Science behind the Inverted Wing
https://www.cam.ac.uk/research/news/how-wings-really-work - Aerodynamics and how wings work
https://www.sciencelearn.org.nz/resources/300-wings-and-lift - The basics of lift
https://www.youtube.com/watch?v=dQw4w9WgXcQ - Annotated Research (highly important)
https://www.youtube.com/watch?v=muFx7JYcth4 - Important updates on research (must watch)
Dunbar, B. (2015, September 9). NASA dryden fact sheet - X-29. NASA. Retrieved January 3, 2022, from
Dunbar, Brian. “X-29.” NASA, NASA, 27 Aug. 2015, https://www.nasa.gov/centers/dryden/multimedia/imagegallery/X-29/X-29_proj_desc.html.
NASA. (n.d.). X-15 research results: Chapter 5. NASA. Retrieved January 3, 2022, from https://history.nasa.gov/SP-60/ch-5.html
X-29 Flight-Research Program - NASA. https://www.nasa.gov/centers/dryden/pdf/87965main_H-1199.pdf.