Tualatin High School
Tension Forces effect on Frequency Produce from a String: Intro || Investigation || Setup || Design || Variables || Assumptions || Data || Graphed Data || Understanding Data || Log Graphs || Conclusion || Limitation || Final verdict || Return to Research
I have always been curious as to how instruments such as guitars work. Some of my dad’s favorite songs such as Stairway to Heaven by Led Zeppelin, and some of my favorite songs such as Roundabout by Yes and More than a Feeling by Boston use guitars to make a great song. These songs include a guitar that really ties the song together. When it came to understanding how a guitar worked, I generally only understood that you turn the tuning keys to tighten or loosen the string in order to produce the right pitch.
Tension on string
What the tuning keys do is pull on the guitar strings, resulting in changing tension force exerted on the strings. By tightening the string, we control how much the string itself is able to vibrate when plucked.
To define tension quickly, it is a force that is exerted by a rope, chain, or cable. The rope, chain, or cable will barely stretch as the force pulls it in the respective direction. A rope becomes taut when it is stretched, which allows forces from one end to reach the other. The stretch from pulling the rope to make it taut is so marginal, that we don’t take notice of its effect on the length of the rope. When the force of tension is too great on the rope, it could cause it to break, so strings such as guitar strings are meant to be able to withstand great amounts of tension from the tuning keys.
Besides guitars, tensile strength is used in many aspects of our daily lives, as our architecture uses rebar within concrete in order to strengthen against the stretching and pulling of said concrete. It’s also impressive that we have transformed art by using tension on strings to create string instruments, which rely on being taut to vibrate, and in turn, producing a sound.
Tension
in the investigation
The primary focus of this investigation is to study and understand the effects of tension on the frequency produced by a string. In turn I will use a combination of graphs and mathematical equations to explain and justify my results.
My understanding of frequency in terms of waves is that when it comes to
standing waves, wavelength is equivalent to double the length,
therefore we would also be able to say that the formula for frequency is the wave
speed divisible by twice the length traversed.
![]() ,
,![]()
![]()
I understand that this is because when analyzing the first harmonic of a standing wave, you have two nodes, one antinode. As such you have your length of the string as one half of the wavelength.
In order to understand the relationship between the two variables I am testing. I need to define the factors that I will be exploring in this experiment. Only one variable, the independent variable, will be actively changed, whereas the dependent variable will be recorded in order to demonstrate the purpose of the investigation.
I will limit the investigation to be on the frequency in Hz that recording devices are able to detect, as such I will be limiting the range of weight in grams between 500g - 1800g, as the device becomes harder to maintain accurate constant variables such as string density, plucking strength, and length of string (changes slightly when applying more mass). Ranges below are also rather unreliable as there is not enough tension to evoke a frequency audible by the recording device.
Initial Setup of the Experiment
Nylon String: The choice to use nylon string was because it was readily available to me in the classroom. It is very similar to the strings used on instruments such as ukuleles, so I figured it would be rather easy to pluck
Sonometer: Also found within my physics classroom was a sonometer, which would be perfect for what I was doing with my experiment. I was able to hoist the nylon string on one end, then have a pulley at the other end for the string to then curve over the edge and suspend a mass over. Drawing 1 down below shows a drawing of what I plan to do with the sonometer in order to experiment with my two variables.
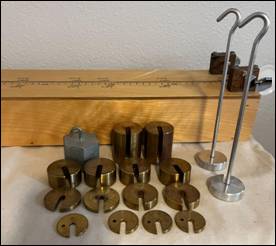
Mass: I would also have to use some weights in order to create the tension required to demonstrate the relationship between itself and frequency. I was provided with a gram mass that suspends on the device hanging off the string on the pulley in the drawing above. Down below is an image of the weights and the tool(s) that would hold them.
Recording device: In order to record the frequency of the sound, I would use a mobile phone as a microphone and an app that would deduce the frequency of the most prominent sound that the phone could pick up. The app is called n-Track Tuner, which comes with a variety of features such as guitar tuning and a digital tuning fork; however I will be limiting my usage of the app to the spectrum analyzer.
Design of the Experiment
The purpose of this investigation is to determine the relationship that tension has on the pitch produced when plucking a taut string. As mentioned before, the investigation will be limited to focusing on using the same nylon string rather than attempting to see any differences between other kinds of string like guitar strings or threaded string. The design of the experiment is to have controlled variables to be as controlled as possible, and those said controlled variables will be discussed in the next section on variables. This is so that we are able to alter the tension force and see the effects it has on the frequency produced by the string. My data will come from me holding my phone to one end of the sonometer and then plucking the string with the same plucking method across all data points. I will then record the frequency the app is able to pick up onto a google spreadsheet. I would be doing the same instance three times, for example, I would use 500g to weight down the string and make it taut and I would pluck the string three times when using that weight to record for data. I would then go up by 50g until I reach 1000g, where I would then increase the weight by 100g per instance for testing.
Independent, Dependent, and
Controlled Variables
Independent variable: Tension (N). In order to produce tension, I need to put a weight at the end of the string to make it nice and taut. I will then calculate the force that the tension is producing on the string as gravity pulls it down. We will be using the formula of force equating to mass multiplied by the acceleration of gravity, in order to calculate the force that the weight is pulling the string at. This can be demonstrated by the picture on the following page.
Weight: 500 grams
(g)
![]()
Tension (N) = Force
(N)
![]()
Force (N) = Mass (kg) x Acceleration
(ms-2) ![]()
This weight will then, as stated before, be raised by increments of 50g until 1000g, where it will then increase by 100g until it reaches 1800g.
Dependent variable: Frequency (Hz). This is the sound produced when I pluck the string when it has the weight at the end. The smallest unit of measurement the recording device can register is 0.1 Hz, so there is a general uncertainty of +-0.05 Hz in each of the data points individually.
Frequency is a result of the wave speed divided by the frequency, as demonstrated in the picture below.


In order to calculate the wave speed (v), we need to use our tension in order to find the wavelength (λ). Wave speed can be described as the square root of tension divided by the linear density of the string. In the picture below, it also defines linear density as the mass of a string per unit of measurement; in this case I made sure to collect the mass of one meter of the nylon string in order to be able to reverse engineer the equation.
|
Weight (1 meter) |
25 x 10^-4 kg |
(+-) 0.005cg |
Length |
1 meter |
Length Uncertainty |
(+-) 0.05 cm |

Constant variables:
- Length of string: The length of the string will be kept to 0.9m, while the rest of the string will hang off to the pulley as shown in Drawing 1 from earlier. If you look closely at the drawing you will notice a white vertical rectangle, this is supposed to mimic a bridge on a guitar, which limits the string vibrating at 90 cm.
- Pluck strength: In an attempt to make sure that I reproduce the same sound, I would need to use the same amount of pluck on the string in all instances. Since the length of the string is set to 90 cm, I went to the center at 45 cm, and plucked the string fully, meaning I pulled the string so that it touched the sonometer. This would ensure that I would always pluck the string in a similar way, as having different string plucks would vibrate the string differently.
- Wavelength: As we discussed earlier, we are also able to derive the wavelength from taking the first harmonic, which makes the wavelength twice the length.
A list of general assumptions for the sake of making the investigation simple and clean includes:
- The device used as a bridge for the sonometer was not fixed in place, and was made sure by me that after I plucked the string that it was not off of its 90 cm mark in order to ensure that length was kept constant
- The method I use for plucking the string is constant. While the method of pulling the string down to the wood of the sonometer and releasing it is an effective way to replicate the way I strum the string, I am assuming for the investigation that there is little to no difference in how I strum the string.
- Gravity will be valued at 9.81ms-2, in order to calculate the force provided by the tension
Data
Collection
Data is collected by the frequency the mobile app that I used picks up. I ensure that after I pluck the string that I let the string vibrate for half a second until I see a relatively consistent value on the registered frequency from the recording app.
My process for collecting the data began with ensuring that the bridge was in the correct spot at 90cm on the sonometer. Next, I would apply the appropriate weights to hang off the string from the pulley system, and make sure to secure them on safely as it would be a shame to have a 500 gram weight fall on your toes. Next I would pluck the string with the previously mentioned method at 45cm on the sonometer. Quickly, I would look towards my phone at the end of the sonometer, read the most consistent frequency read, and record it into one of three trials at the given weight. Afterwards, I repeat the steps mentioned above until I have three trials of each weight. I would then average the frequencies recorded in the column labeled Frequency (Hz), and then calculate the uncertainty of the data from the three trials. I kept the amount of trials to a simple three as I did not want to stretch the string too much when gathering data, as that would change the length of the string drastically, which alters my results. Another reason was that within my house, there are lots of other noises going on that could result in slight changes of Hz detected from the sonometer, so often I would get the sound of my dogs barking or my family interrupting.
Down below is an example of some of the earlier data points collected. I began at 500g of weight (4.91 N of tension force), as it produced the most consistent frequency for the recording app to register somewhat consistently. I stopped at 1800g (17.66 N of tension force) as the stress on the string was bound to cause more and more stretching on the string, and data collection was stopped there to ensure that the string’s length wasn’t drastically warped.
|
Weight (g) +- 0.1g |
Tension (N) +- 0.005 N |
Frequency Hz +- 0.05 Hz |
|||||
|
Weight (g) |
Tension force (N) |
Trail 1 (Hz) |
Trail 2 (Hz) |
Trail 3 (Hz) |
Frequency (Hz) |
Uncertainty |
|
|
500 |
4.91 |
80.1 |
80.4 |
80.3 |
80.27 |
0.15 |
|
|
550 |
5.40 |
83.7 |
83.6 |
83.2 |
83.50 |
0.25 |
|
|
600 |
5.89 |
87.7 |
86.5 |
86.6 |
86.93 |
0.60 |
|
|
650 |
6.38 |
91.4 |
91.6 |
91.5 |
91.50 |
0.10 |
|
|
700 |
6.87 |
94.1 |
94.8 |
94.7 |
94.53 |
0.35 |
|
Beginning with 500g of weight, after each trial I would add 50g of weight to the end of the string. Then, once I reached 1000g, I would then add 100g of weight in order to get greater ranges of weight.
Graphed data
The following graph displays all the data collected, which includes 19 different variations of tension and utilizes the average of the three trials as its data points.
As we can see from the trend line that runs through the data, it is not quite linear. This is to be expected, as within the calculations of wave speed (V), we understand that it is the square root of tension divided by the linear density of the string. Using the graphing program desmos, I was able to utilize the formula to depict a graph given a full range of tension.
Understanding the
data
We are able to see how the data on the first diagram matches that of the second in that it is a square root. As such, we should be able to at any data point calculate using our constant variables, and any variation of our independent variable of tension, to replicate what is displayed on the graph. Let us pick two different points from the data collected.
|
Weight (g) +- 0.5g |
Tension (N) +- 0.005 N |
Frequency Hz +- 0.05 Hz |
|||||
|
Weight (g) |
Tension force (N) |
Trail 1 (Hz) |
Trail 2 (Hz) |
Trail 3 (Hz) |
Frequency (Hz) |
Uncertainty |
|
|
500 |
4.91 |
80.1 |
80.4 |
80.3 |
80.27 |
0.15 |
|
|
550 |
5.40 |
83.7 |
83.6 |
83.2 |
83.50 |
0.25 |
|
|
600 |
5.89 |
87.7 |
86.5 |
86.6 |
86.93 |
0.60 |
|
|
650 |
6.38 |
91.4 |
91.6 |
91.5 |
91.50 |
0.10 |
|
|
700 |
6.87 |
94.1 |
94.8 |
94.7 |
94.53 |
0.35 |
|
|
750 |
7.36 |
97.7 |
96.5 |
96.7 |
96.97 |
0.60 |
|
|
800 |
7.85 |
100.2 |
100.9 |
100.6 |
100.57 |
0.35 |
|
|
850 |
8.34 |
103.5 |
103.6 |
103.4 |
103.50 |
0.10 |
|
|
900 |
8.83 |
106.5 |
106.3 |
106.9 |
106.57 |
0.30 |
|
|
950 |
9.32 |
109.9 |
109.8 |
108.8 |
109.50 |
0.55 |
|
|
1000 |
9.81 |
111.8 |
111.9 |
112.2 |
111.97 |
0.20 |
|
|
1100 |
10.79 |
117.5 |
116.9 |
116.6 |
117.00 |
0.45 |
|
|
1200 |
11.77 |
123.6 |
124.3 |
123.8 |
123.90 |
0.35 |
|
|
1300 |
12.75 |
128.9 |
128.6 |
128.4 |
128.63 |
0.25 |
|
|
1400 |
13.73 |
134.4 |
133.2 |
133.6 |
133.73 |
0.60 |
|
|
1500 |
14.72 |
137.9 |
137.9 |
138.2 |
138.00 |
0.15 |
|
|
1600 |
15.70 |
142.3 |
142.5 |
142.7 |
142.50 |
0.20 |
|
|
1700 |
16.68 |
146.5 |
147.3 |
146.8 |
146.87 |
0.40 |
|
|
1800 |
17.66 |
151.6 |
151.4 |
151.3 |
151.43 |
0.15 |
|
I will be taking the first data point of 4.91N of force. I will be using the constant variables of gravity, wavelength (averaged), mass & length of string, the independent variable of tension, and compare it to the dependent variable, frequency at both given instances of the independent variable.
Instance: 500g
In this instance, using 500 grams gave us a frequency relatively close to what was depicted in the data. The difference is minimal, only 0.61Hz of difference from the actual average of that frequency (80.27 Hz) at the given tension.
When compared to the data table’s data points, the formula is able to relatively calculate the frequency produced at the appropriate tension from the weights. This equation also justifies the reason as to why the graphs of the data appear to be square rooted, as we are taking the square root of our independent variable, tension, within the formula. By calculating using the formula for two data points we are able to see the effect that tension has on frequency, and how it is not linear but rather they are rooted.
Log of
tension vs. Log of frequency graph
We are better able to see how when putting the data into a graph that puts the data points into the formula Log(T) and Log(F), we are able to see how the rate at which tension changes, there is a steady increase in the rate log(F) changes. We are given a line of best fit that enables us to see steadily over the course of the data the relationship between the two.
Conclusion
In conclusion, the relationship between tension and frequency produced by the sonometer is demonstrated by the myriad of other factors
such as the linear density, and wavelength come into play when determining the
frequency produced. The formula that best depicts the expected outcome is
listed as:
![]()

![]()
By using these constants we are able to take into account what tension will cause what frequency. As for why my general wavelength was calculated to be 0.58641 meters, when taking into account that for the first harmonic of frequency, we understand that the wavelength is twice the length, also known as the wavelength is half the length, we are able to determine that the frequency being captured is also half the frequency, as when using half the wavelength, we are given double what our spectrum analyzer gives us.
That is to say that with those constants, we can adjust the taut state of a string in order to produce higher frequencies. I believe that the reason it increases in such a way is that the tension is being applied to the taut state of the string. This is why in the formula, the tension is divided by the linear density, as the wave speed of a taut string is going to have to vibrate through the string and through its taut state as such it is the medium in which the wavelength has to travel through. This in short would make sense as to why we take the universal formula for wave speed (v = (f)(λ)) and have it divisible by wavelength in order to calculate the frequency (f = v/λ). You are calculating the speed of the wave at a given unit of wavelength to get the frequency at which the wave occurs in that unit of time. Overall this makes the sound produced by guitars and other instruments make a lot more sense to me.
Limitations
Some limitations of the investigation were definitely the amount of data points I was able to collect without causing the nylon string to stretch so much. If I was able to use a guitar string, perhaps I could have collected a wider variety of data points that would better showcase the square root nature of the data.
Another greater limitation is the human error when it comes to not only plucking the string, but also reading the frequency produced. Both of these limitations create human error in the investigation, although my plucking method was designed to limit to a greater extent plucking the string a different way would have, meanwhile having to quickly read the frequency produced often was difficult as the sound registered would only be readable for a second on the app I was using.
The bridge used for the sonometer not being fixed in one place likely cause the actual length of the string to change even by a couple hundredths of millimeters, as putting on more weights, taking off weights, and having to adjust the bridge to the correct length of 90cm was constant, and likely creating minor differences in what should have been a controlled variable that does not change.
If there were any changes to make in future investigations into tension’s relationship between frequency, it would be to make sure that you use a good material for the string that won’t stretch too much like mine would, and to ensure that you limit any controlled variables changing even if they change by 0.0001 m, as even a difference that small can mean a completely different frequency calculated.
Of course another detail to make future investigations better would be to use more than a single string, and use new strings in different trials in order to have the sound best preserved. This would allow more trials to be conducted and only enable a better, more precise and accurate data collection.
Final verdict
Overall I feel confident in my data collection, and proud that I was able to apply my knowledge of physics to a real life situation that interested me. Before, I never really thought of the physics behind music and the sounds that are produced from said instruments. Each instrument on its own uses different properties of physics to create vibrations into sounds, and looking into the science of an instrument like a guitar made me appreciate more the science within music.
Bibliography
- “What is tension? (article) | Tension.” Khan Academy, https://www.khanacademy.org/science/physics/forces-newtons-laws/tension-tutorial/a/what-is-tension. Accessed 28 February 2022. - Useful in researching and understanding the tension of a string.
- Admin. (2020, July 28). Tension force. BYJUS. Retrieved May 27, 2022, from https://byjus.com/physics/tension-force/ - Useful in understanding the impact and how force of tension works on pulling forces.
- Encyclopædia Britannica, inc. (n.d.). Encyclopædia Britannica. Retrieved May 27, 2022, from https://www.britannica.com/science/tension-physics - Demonstrates the change (minor) in tension of a substance and material.
- Libretexts. (2022, February 20). 4.5: Normal, tension, and other examples of forces. Physics LibreTexts. Retrieved May 27, 2022, from https://phys.libretexts.org/Bookshelves/College_Physics/Book%3A_College_Physics_(OpenStax)/04%3A_Dynamics-_Force_and_Newton's_Laws_of_Motion/4.05%3A_Normal_Tension_and_Other_Examples_of_Forces - Impact of tension in real world scenarios.
-
Wikimedia
Foundation. (2022, May 13). Tension (physics). Wikipedia. Retrieved May
27, 2022, from https://en.wikipedia.org/wiki/Tension_(physics)
- Useful in
multiple perspectives and explanations of defining and understanding tension
and its multiple applications.