Contents
How much salt does it take to get the density of the Dead Sea? The Dead Sea has 33.7% salinity because of large salt deposits throughout the sea. The density of the Dead Sea is 1.24g/cm3, compared normal water which has a density of 1 g/cm3. We wanted to see what effect small amounts of salt had on waterĺs density, and see if we could find the ratio of salt the Dead Sea has. We hoped to recreate the effects Salt has on the density of the Dead Seaĺs water on a much smaller scale.We will graph our data and then use those results processed through Google Sheets in order to find a line of best fit.
Question: What effect does different amounts of salt have on the density of water? Variables: Our independent was the salt, and dependent was the density of the water. Our controlled was the amount of water, 100 mL. (We need to explain these further) Hypothesis: As the salt increased, so would the waterĺs density.
Picture or Diagram of setup
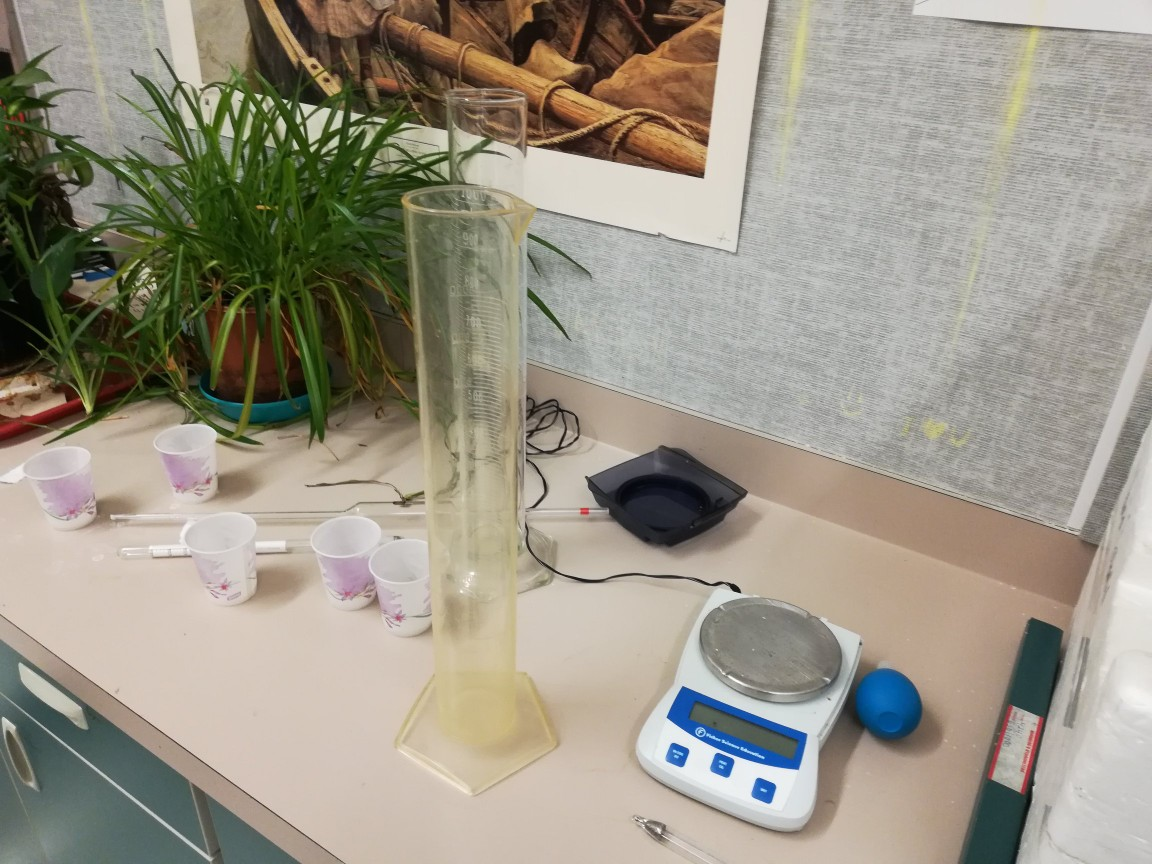
Fill cup up with 100 mL of water. Measure weight of cup with 100 mL of water. Add salt Wait for salt to mix with water Measure new weight of water with salt added Calculate density of water with added salt Repeat with increased amounts of salt.
Data in csv
Use density of salt relating to the volume of salt added and then use that to find change in density from original cup to altered cup
We chose to present our data through basic data tables with our mass of salt in one column, water weight in grams before we added salt, water weight in grams after we added salt, the density of salt in grams, and finally the uncertainties with each trial. We chose this method because it was the easiest and cleanest way to present our trials and data found as well as our uncertainties, which are presented from left to right as we discovered our data.
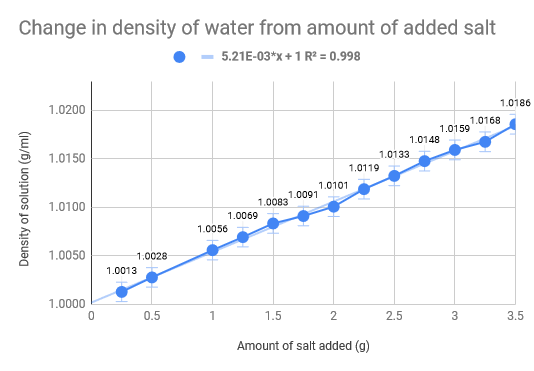
Linear Regression
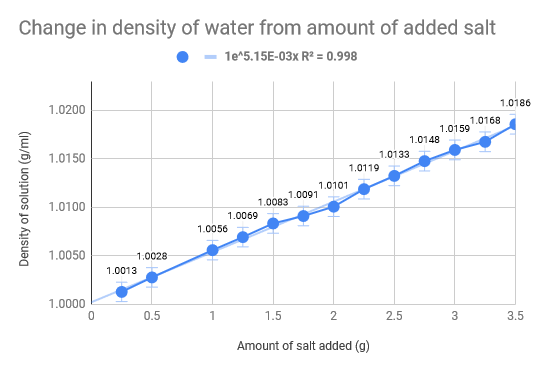
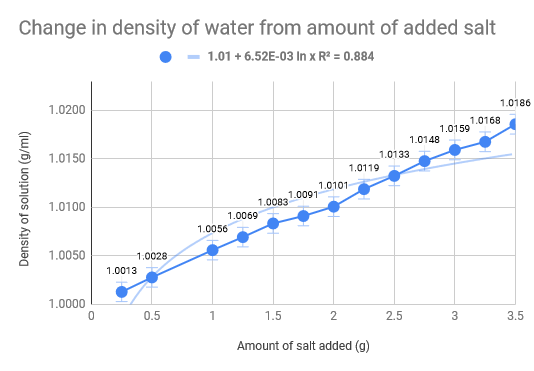
As we had previously hypothesised, the density of the water increased as the amount of salt increased. The density of normal saltwater is around 3.5 times heavier than regular water, therefore there are about 35 kg of salt in each 1,000 kg of water (Comptonĺs Interactive Encyclopedia). The salinity of the Dead Sea (33.7%), where the density of the water of the Dead Sea is 1.24g/cm3, we found that for our experiment we would need roughly 46 g of salt to replicate the Dead Sea. Our data collecting started with .5g of salt leading all the way up to 3.5g, with increments of .5g. The 100 mL of water was eight and thus we mixed the salt and water, weighing it after. The used the density formula D = m/V to calculate the density and used the uncertainty formula to calculate that as well. The limitations of our experiment come down to errors in water measurement and errors is salt measurements. The experiment would have definitely benefited from more accurate equipment and materials, such as a more precise scale and distilled water. Additionally, the temperature also fluctuated which could have had implications on our data we received. To add on top of that, we did not do multiple trials for each amount of salt in the water, which would have made a much more accurate uncertainty for each trial.
The Dead Sea A bit of information on the Dead Sea, detailing the how much salt is in the sea, and the density of the sea water.
Water Density A link to USGS talking about the density of water.
Various Densities of Salt A link to a website talking about the density of table salt.
Density of Seawater A link to a website talking about the density of saltwater.
Affect of Salinity and Temperature on Density A link to a website talking about the affects of Salinity and temperature has on density.