Sam Mortensen
January 23 2017
Period 5
Physics IA: Nerf Dart Optimization
The purpose of this investigation is to determine the effect that projectile mass has on the range of a foam dart fired from a spring powered dart blaster. For some inconvenient reason, young boys are indomitable drawn to violence; a violence that was commercially marketed as a ‘safe’ and ‘fun’ part of childhood when Hasbro released the Nerf sharpshooter dart blaster in 1992 (Michal). Since the blaster’s explosive success that year, Hasbro has continued to evolve the technology in both their darts and blasters. The goal of Nerf dart-tag as a sport, and the purpose of a dart blaster, is to allow a player to aim at and effectively tag an opponent as accurately and from as far away as possible. There are two major factors that go into the production of a darts trajectory, the blaster and the dart itself, however the dart is ultimately where the real science comes into play. While the force can be upgraded in a spring powered blaster by increasing the resistance of the spring, or the voltage of a flywheel can be upgraded in a motorized blaster, when both players have the same blaster, the darts are what help determine the winner. In short, a blaster is only as effective as the darts it’s shooting, making a more accurate player dependant on a more precise dart.
Because of Nerfers’ dependence on a highly functional dart, and my personal desire to be successful in my own dart-tag endeavors, I have crafted this investigation to isolate the values and limitations of darts with unique weights in order to find which one I should use to be the most successful. For the purpose of this investigation, I will be focusing my research on the highest performing dart in terms of range. A variety of darts will be tested in order to narrow down to best fit, however some of Nerf’s earlier year dart types will be omitted due to their significant lack of performance, and a few unreasonably expensive aftermarket darts will be omitted due the impracticality of purchasing them.
What is the optimal weight of a nerf dart?
Independent variable: Weight of dart in grams (+/- .005g)
Dependent variable: Distance traveled by dart in meters (+/- .005m)
Controlled Variables: Type of Nerf dart gun (Elite Firestrike) and therefore the force being applied on the darts, temperature of the room, height being fired from (1.6 meters), angle being fired at (15 degrees).
Control (Dart 5): Nerf Streamline darts (1.25 grams (+/- .005g) )
These darts were used as the control because they were the original dart in the Nerf N-strike series. All the other darts chosen were advertised as “upgrades in performance” from this dart.
Dart 1: Nerf Accustrike darts (1.07 grams (+/- .005g) )
Advertised to be upgraded for performance and accuracy.
Dart 2:
Nerf Elite Darts (0.98 grams (+/- .005g) )
Advertised to be upgraded for performance.
Dart 3:
Aftermarket Little Valentine darts (1.16 grams (+/-
.005g) )
Inexpensive compared to Nerf darts, and in the
same weight division as the rest of the darts. Advertised to
be upgraded for performance and accuracy over standard Nerf Streamline darts.
Dart 4: Nerf suction cup darts (1.36 grams (+/- .005g) )
Advertised to be upgraded for performance.
Materials
and equipment
● Nerf Elite Firestrike (spring powered) dart blaster
● Five varieties of Nerf darts with different weights
● A heavy table and vice grip, (a stable, secure structure to mount the Nerf blaster to).
● Measuring tape
● An open, flat, indoor range at least 20 meters long
● A high speed camera (iPhone 6s)
● Masking tape
● A pen
Safety
considerations
Dart tag is a fun and competitive sport, but should always be played safely. Similarly to the safety precautions taken when handling a real firearm, a dart blaster should never be pointed at something or someone you do not intend to hit with a dart. Even though the darts are made of foam, their hard rubberized tip can cause significant pain or damage if someone is hit in the eye, making wearing goggles an essential part of playing dart tag at all times.
Experiment
procedure
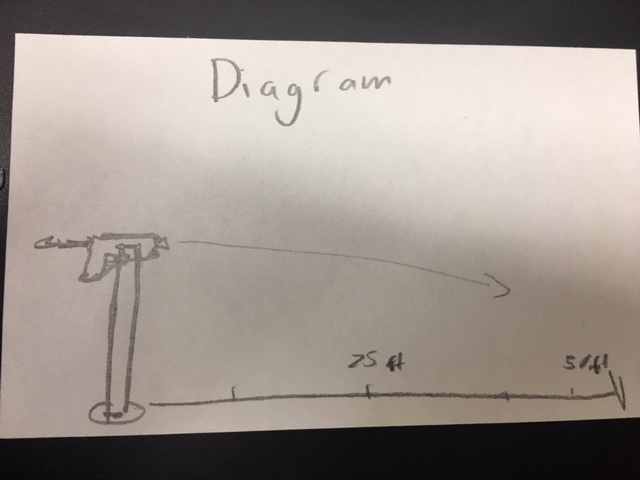
To gather data for this experiment, a total of 15 shots per dart type were fired, using a brand new individual dart for each shot, (a total of 75 darts). The setup took place in a warehouse where there was no wind or other potential interferences that come with being outside. A mounted dart blaster, (the Elite Firestrike), was mounted in a vice grip and placed on a steel table, with the muzzle of the dart blaster 1.6 meters from the floor, pointing at a 15 degree angle upwards, to simulate the trajectory and position that may be used from a player firing a nerf blaster in a game. Masking tape was placed on the floor every tenth of a meter and marked with a pen to indicate to the camera at which distance the dart was landing.
Darts are front loaded into the blaster, and do not pass through a barrel before taking flight, they are fired directly from the plunger tube with the head of the dart sticking out. One at a time darts are loaded into the blaster, the plunger is pulled back, and the trigger is pulled depressing the spring that forces air from the plunger tube into the dart, sending it airborne. This process is repeated 15 times for each of the five dart types of varying weights. A high speed camera is set up down range to record the impact of the dart. The footage is later analyzed to determine the impact position of the dart rather than the end position of the dart, considering the fact that the darts will bounce and roll after hitting the floor.
Data
tables
The following table shows raw data taken from the measured distances in meters (+/- .005m) that each of the 15 darts per dart type traveled.
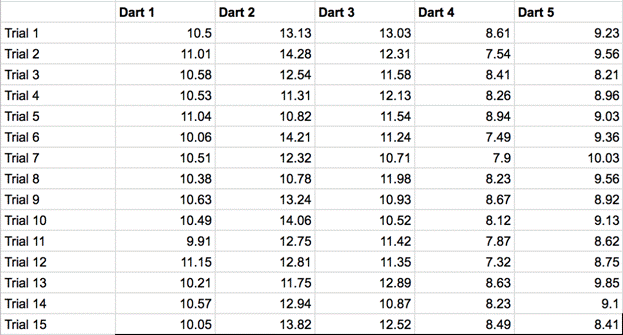
Table 1
Below are the averages of all of the 15 distances traveled for each of the five dart types, as well as the weight of each dart type.
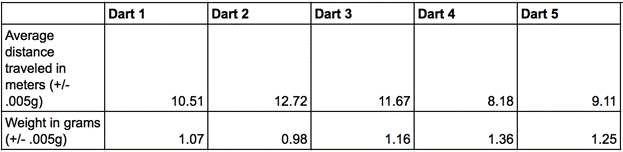
Table 2
Averages calculated by adding up all the distances yielded by each dart type, and dividing by the number of total trials. An example of such calculation can be seen here, using Dart 1.
Sum of trials (157.62) / 15 = 10.51
Data
visualizations
Figure 1 shows a graphical representation of the distance traveled compared to the weight of the dart fired. It’s important to note that the dart types as they are listed throughout this paper are not relevant here. In figure 1 the darts are listed in ascending order of weight to aid the trend of the graph, not in order of dart type.
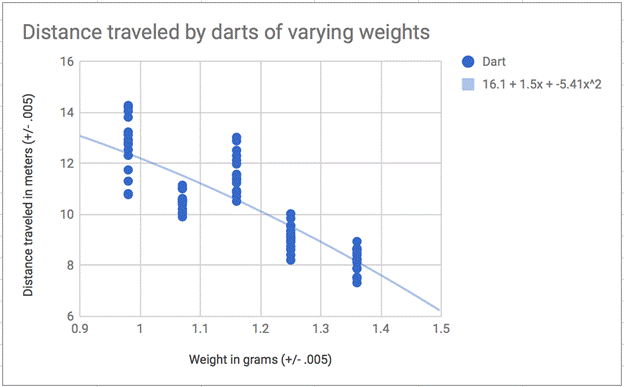
Figure 1
The second degree polynomial trendline produced helps direct the flow of the data, as well as serve analytical value to help predict the range of a dart with a different weight than those that were tested.
Figure 2 visualizes the horizontal distance traveled by all darts compared by dart type.
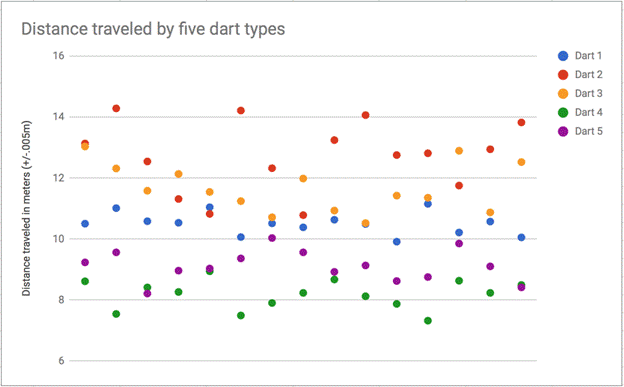
Figure 2
Data
analysis
Despite Dart 1 having a slightly sub-average performance according to Figure 1, the graph depicts a clear downward trend in the range of a dart as its weight increases. The heaviest dart weighing 1.36 grams, traveled an average distance of 8.18 meters, while the lightest dart weighing 0.96 grams traveled a significantly farther average distance of 12.72 meters. In order to determine which dart weight has the farthest range, conclusions from both graphs and data tables can be drawn to determine the clear winner. Not only did Dart 2 yield the farthest distance traveled by any dart, it also yielded the longest average distance travelled by more than a meter (roughly 9%) farther than the next longest range dart. Additionally, Figure 2 illustrates Dart 2 achieving the top six shots among all dart types.
At this point it’s reasonable to conclude, if the objective as a dart tag player is to have the longest possible range, that Dart 2 is the best option. However, there is another crucial factor in the performance of a Nerf dart that determines its effectiveness, and that is its precision. To calculate this precision, the data collected from the initial experiment was used to find range and standard deviation, and create graphs that help the visualization and analysis of this data.
Table three compares the condensed data of all trials, comparing the five dart types and their different range and precision related values.
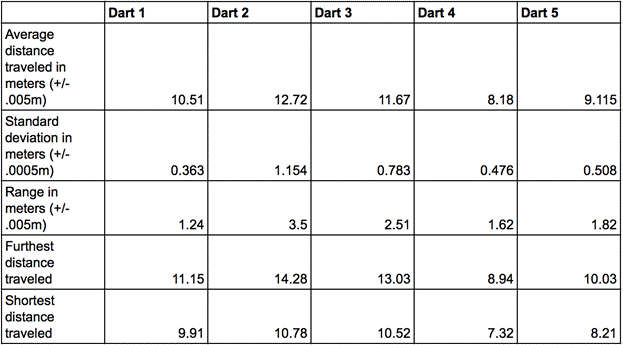
Table 3
Range was calculated by subtracting the shortest horizontal distance traveled by any dart within the trials of a given dart type from the longest horizontal distance traveled. A larger range means a less precise dart; the target zone with which your dart is predicted to land in will be larger thus creating a lesser likelihood of you hitting your target in the center of this zone. It’s important to keep in mind the difference between this range, or the spread of the darts referring to precision, and the range as in the distance traveled.
An example of this calculation is shown below with Dart 1.
(11.15 - 9.91) = 1.24
Standard deviation was found by calculating the deviations of each data point from the mean, and squaring the result of each: the variance is the mean of these values: and the standard deviation is equal to the square root of the variance (Pierce).
The standard deviation has a significant correlation to the range, as they both indicate the closeness of the relationship between the trials of a given dart type. Therefore, the greater the standard deviation, the less precise the dart is, as there is a greater distance between it and the next predicted shot.
In Figure 3, the standard deviation, weight, and distance traveled by each of the five dart types are compared.
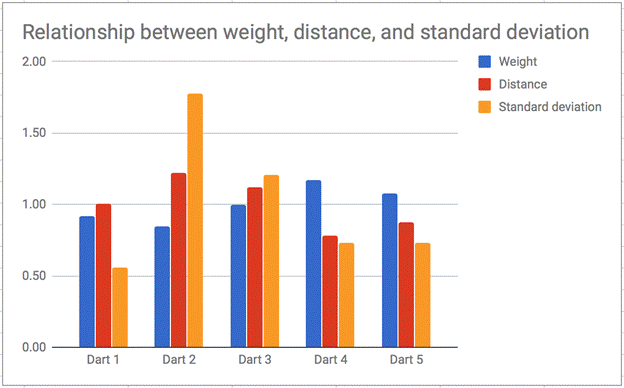
Figure 3
In order to properly create a clear visualization of these results, the weight in grams, distance in meters, and standard deviation of the average distances in meters, were all converted to percentages. In order to to this, the following procedure was done to all three values for each dart.
The means of each of the fives dart weights were averaged, and then each of the individual Dart type means were divided by that average, to yield a percentage of the average. This produced an equal proportion among the different variables that could be compared numerically and visually as seen in Figure 3.
An example of this calculation is shown below with dart weight averages used to calculate Dart 1 as a percentage.
Weight averages (1.07 + 0.98 + 1.16 + 1.36 + 1.25) / (5) = 1.143
Dart 1 (1.07)/ 1.143 = 92.04%
Table 4 shows the remainder of the calculations done to complete the visualization of Figure 3.
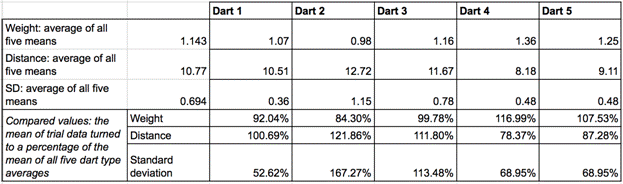
Table 4
Conclusion
After thorough examination of all the data yielded, the experiment proved that Dart 2 (Nerf Elite darts), the darts of the lightest weight, were objectively the highest performing in terms of range. As stated previously, they had the farthest average distance traveled, and consistently performed better than almost every other heavier dart, (with the exception being Dart 3 having a few of the longer shots reaching into the average range of Dart 2). This means despite the range or spread of Dart 2 being greater, there is still a significant likelihood that the dart will travel farther than any other dart other than Dart 3, and on rare occasion Dart 1- see Figure 1 or Figure 2.
However, as the experiment progressed it became clear that the data collected could be repurposed to evaluate the precision of the darts as well. This is when the winner of this competition becomes less clear. While Dart 2 had the greatest distance performance, it has by a measure the worst performance when it comes to precision. For the purpose of finding the highest performing dart, the lack of range and therefore largely irrelevant precision of Darts 4 and 5 (not a surprise), will omit them both as contenders. As seen in Figure 3, in most cases as the weight of a dart increases, the range decreases. However Dart 3, heavier than Dart 1, managed to yield better distances but less accuracy. These findings generate a spectrum of performance. On one side Dart 2 is clearly the farthest shooting, while Dart 1 is clearly the most accurate, but Dart 3 seems to strike a reasonable balance of the two. While it’s standard deviation from the average shot was fairly high at .783 meters, compared to .363 meters with Dart 1, it still yielded notable higher distances than Dart 1, and remains far less imprecise than Dart 2. In conclusion, if you are outdoors and need maximum range, use Dart 2, if you’re indoors playing at shorter distances and need precision, use Dart 1, and if you’re buying darts in bulk for all purposes, Dart 3 will strike a serviceable balance.
Errors
Multiple procedural errors occurred, potentially resulting in an impact on the data gathered.
● The distance traveled by the darts was measured from high speed video taken to determine dart impact, rather than relying on a human’s visual perception. The floor was only marked every decimeter, so the exact impact points of the darts were negligible beyond 0.1 meters.
● In addition, the high speed video captured the distance traveled at the center line pointing straight out from the muzzle of the blaster, not a direct line from the muzzle to the impact. Meaning a dart that hit the ten meter mark but flew a meter to the left, would only be recorded as flying 10 meters, when in reality it flew a little over that considering pythagorean theorem.
● The rubberized tips of the darts were what accounted for the difference in weight between the dart types (the foam bodies all weighed the same), however one critical component of a darts flight trajectory and power is air resistance, which was not accounted for in this experiment.
Suggested
improvements
● Conduct more tests, both by using more darts of the same type and testing a larger variety of dart types. This will help create a stronger understanding of the true impact of weight on a dart, and could help narrow down other potential contributing factors to a dart’s performance.
● Measure darts left to right landing points, (the square root of, (the distance squared) times (the distance outward from the centerline squared) rather than just distance. This will provide obvious improvements regarding actual range of darts, however will also need to be considered when comparing these adjusted differences to the precision.
● Research could include the use darts all of the same aerodynamic properties (tip shapes) to eliminate the problem of potential inconsistency among air resistances.
● Research could include the use of different dart blasters, (potentially a motorized blaster), to evaluate whether the results are any different than those yielded from a spring blaster. Not all Nerfers use spring blasters, so restricting this study to one blaster type somewhat limits the relevance of the findings.
Michal, M. (2005). Sharpshooter. Retrieved from http://nerf.wikia.com/wiki/Sharpshooter
Staff, H. (n.d.). Marshall Plan - World War II. Retrieved from
Murmson, Serm. "Science Project: The Effect of
Mass on the Distance a Ball Travels." Sciencing, http://sciencing.com/science-project-effect-mass-distance-ball-travels-2550.html.
25 April 2017.
Pierce, Rod. "Standard Deviation and Variance" Math Is Fun. Ed. Rod Pierce. 17 Oct 2016. 23 Jan 2018 <http://www.mathsisfun.com/data/standard-deviation.html>