A Study Dedicated to Finding the Relationship Between Mass and Terminal Velocity
Makana Johnson
Table of Contents
The purpose of this investigation is to figure out the relationship mass has with an object’s terminal velocity. I have always found the concept of falling very interesting. While gravity on earth is relatively constant, air friction is not. Thus, I wanted to study the drag coefficient and velocity of the fall, leading into terminal velocity.
Terminal Velocity is “When an object which is falling under the influence of gravity or subject to some other constant driving force is subject to a resistance or drag force which increases with velocity, it will ultimately reach a maximum velocity where the drag force equals the driving force”(Nave). One example of the use of Terminal Velocity as a term is through the sport of skydiving. When a skydiver is falling at the same speed as his drag force he has reached his terminal velocity. According to the Physics Factbook, the terminal velocity of a skydiver is 55 mph. (Elert)
The purpose of this investigation is to find out the exact relationship, between change of the mass of the object falling and the changing terminal velocity as a result of the mass.
I believe the when I change the mass the relationship between change in mass and change in terminal velocity will have an exponential relationship, with the exponent being 2. This is because mass is influential in both the drag and downward force. With two forces using the same variable it is most likely that the relationship will be squared.
- 20 Coffee Filters 6.67cm in
Radius
- 1 Stopwatch
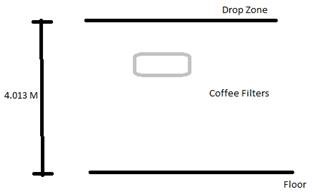
Find a “Drop Zone” that is 4.013 M high then repeat the following steps:
- Drop 1 coffee filter off
of the Drop Zone and time the fall 2 times
- Average the two times in
order to get a more precise answer
- Add 1 coffee filter to
the stack and drop, and time, the filter stack 2 times
- Repeat until the time has been
recorded for a stack of 20 coffee filters.
Once you have the time data, complete the following steps:
- Use the formula s = ((u +
v)/2)t and solve for V (The s=4.013, t=the
average time of the drop. Do this for each of the 20 different stacks,
dropped.
- Calculate the drag
coefficient using the formula (C*ρ*A*(v^2))/2(WikiHow).
C=the drag coefficient. I researched this, because in order to calculate
it you need a wind tunnel. For a coffee filter, the variable is
approximately 1.00(meaning it can be disregarded for this experiment). The
ρ is the density of the air that the coffee filters are falling
through. In my experiment, the density was 1.21 kg/(m^3).
The A is the surface area of the filters, and V is the Velocity calculated
in step 1.
- Calculate the Terminal
Velocity. Use the formula v = sqrt((2*m*g)/(ρ*A*C)). The V is for Terminal Velocity.
The m is the mass of the stack of filters. The G is the force of gravity.
The ρ is the density of the air. The A is the Area of the filters
facing the ground when falling. C is the drag coefficient calculated in
step 2.
|
Amount of Filters |
Weight in KiloGrams |
Time to reach Ground in S |
Velocity cm/s |
Drag Force |
Terminal Velocity in cm/s |
Terminal Velocity in m/s |
|
1 |
0.00068 |
3.42 |
0.23469 |
4.657563 |
26.78744 |
0.267874 |
|
2 |
0.00136 |
2.41 |
0.333046 |
9.379439 |
53.75951 |
0.537595 |
|
3 |
0.00204 |
2.22 |
0.36155 |
11.05363 |
71.47678 |
0.714768 |
|
4 |
0.00272 |
2.01 |
0.399323 |
13.484 |
91.15726 |
0.911573 |
|
5 |
0.0034 |
1.91 |
0.42023 |
14.9329 |
107.2529 |
1.072529 |
|
6 |
0.00408 |
1.785 |
0.449658 |
17.09757 |
125.7172 |
1.257172 |
|
7 |
0.00476 |
1.575 |
0.509613 |
21.96088 |
153.8954 |
1.538954 |
|
8 |
0.00544 |
1.515 |
0.529795 |
23.73481 |
171.0368 |
1.710368 |
|
9 |
0.00612 |
1.405 |
0.571274 |
27.59677 |
195.615 |
1.95615 |
|
10 |
0.0068 |
1.38 |
0.581623 |
28.60571 |
209.9318 |
2.099318 |
|
11 |
0.00748 |
1.345 |
0.596758 |
30.11386 |
225.9079 |
2.259079 |
|
12 |
0.00816 |
1.33 |
0.603489 |
30.79695 |
238.6142 |
2.386142 |
|
13 |
0.00884 |
1.3 |
0.617415 |
32.23474 |
254.0889 |
2.540889 |
|
14 |
0.00952 |
1.2775 |
0.62829 |
33.38021 |
268.3246 |
2.683246 |
|
15 |
0.0102 |
1.26 |
0.637016 |
34.31388 |
281.5998 |
2.815998 |
|
16 |
0.01088 |
1.23 |
0.652553 |
36.00814 |
297.9286 |
2.979286 |
|
17 |
0.01156 |
1.21 |
0.663339 |
37.20833 |
312.1738 |
3.121738 |
|
18 |
0.01224 |
1.2 |
0.668867 |
37.83105 |
323.901 |
3.23901 |
|
19 |
0.01292 |
1.16 |
0.691931 |
40.48508 |
344.2517 |
3.442517 |
|
20 |
0.0136 |
1.14 |
0.70407 |
41.91807 |
359.3912 |
3.593912 |
Looking at the data table, one thing that stands out is the increase in the drag force. Increasing from 4.657 all the way to 41.918, it is clear that adding each filter made a significant impact on the fall. This discrepancy between drag force of each amount of coffee filters, translates over to the terminal velocity, both in cm/s and m/s. All of them follow tight increase windows. The cm/s increases by approximately 16 cm/s each time, and the drag force increases by around 3N. This makes sense, because of the terminal velocity formula, v = sqrt((2*m*g)/(ρ*A*C)) t. It divides by the drag force, meaning there is going to be similarities in the rate of growth, but due to the other variables, the terminal velocity would grow at a higher rate(in numerical value).
Link to Raw Data: Text .:. Excel
Looking at this graph, it is very easy to see that the line of expression: .171x+.258 is very accurate in predicting what the next data point will be. This is in contradiction to my hypothesis, because I estimated that the graph would be exponential rather than linear.
Overall, my hypothesis that the relationship between the change in mass and the change in terminal velocity would be exponential, was incorrect. The graph shown above is demonstrating a trendline with an increase of .171 m/s for every incremental stage of the data collection process. I originally felt that because mass was influential in both the calculations for the drag force as well as the terminal velocity, the relationship would be squared. However, it turns out the relationship is not. This makes sense from a thought experiment. If it was exponential, then it would make it possible for objects with very large mass’ to travel the speed of light and even faster. There are multiple possible reasons as to why the change is linear. The first is that the growth of the terminal velocity is most likely due to the formulas. While the mass is used in both the calculations for terminal velocity and drag coefficient, the final calculation only uses it one time as v = sqrt((2*m*g)/(ρ*A*C)). The second reason could be the laws of gravity. If everything falls at the same rate in a vacuum, then the only calculation to consider is the drag coefficient. I did not calculate this, like stated before, to calculate it you need a wind tunnel. The drag coefficient calculation only uses mass one time, meaning it has to be linear.
Looking back on my experiment, I have found a few sources of error. The first of which is the timing segment. Human error is a big factor, and the fact that I only drop tested twice, makes that error so much more significant. Another source of error could be my calculation for the height of the drop point. Getting the measurement of 4.013 m is very precise, meaning it could be off.
If I had to do this experiment again, I would do the following things to make it more accurate:
1. Find a partner in order to have them help with timing the drops. This will make the results more accurate.
2. Do more drops. Instead of averaging 2 different drops, I would average 5 drops to get the most precise measurements.
3. Use a more efficient drop height. Using something that is 4.013 m tall is not very easy to use, because it is harder to calculate. I would drop from exactly 4 m high.
Elert, Glenn. “Speed of a Skydiver (Terminal Velocity).” Speed of a Skydiver (TerminalVelocity), The Physics Factbook,hypertextbook.com/facts/1998/JianHuang.shtml.
Nave, N. “Terminal Velocity.” Fluid Friction, HyperPhysicshyperphysics.phy-astr.gsu.edu/hbase/airfri2.html.
“How to Calculate Terminal Velocity.” WikiHow, WikiHow, 23 Nov. 2017, www.wikihow.com/Calculate-Terminal-Velocity.
https://en.wikipedia.org/wiki/Terminal_velocity: This is an overview, simplified, about what exactly terminal velocity is.
https://www.grc.nasa.gov/www/k-12/airplane/termv.html: This is NASA’s overview on what Terminal Velocity is, and contains a terminal velocity calculator.
http://www.greenharbor.com/fffolder/weight.html: This is a description of the effect weight has on an objects terminal velocity
http://hyperphysics.phy-astr.gsu.edu/hbase/airfri2.html: This is a list of formulas used in order to calculate Terminal Velocity, with a built in calculator
https://answers.unity.com/questions/1178858/mass-effects-terminal-velocity.html: This is an ask and answer webpage that discusses the effects mass has on an objects terminal velocity.
https://www.thestudentroom.co.uk/showthread.php?t=1890054: This is also an ask and answer webpage that discusses the effects mass has on an objects terminal velocity.
https://www.wikihow.com/Calculate-Terminal-Velocity: This is a description of how to calculate terminal velocity and formulas.